

Supervised clustering of genes
- PMID: 12537558
- PMCID: PMC151171
- DOI: 10.1186/gb-2002-3-12-research0069
Supervised clustering of genes
Abstract
Background: We focus on microarray data where experiments monitor gene expression in different tissues and where each experiment is equipped with an additional response variable such as a cancer type. Although the number of measured genes is in the thousands, it is assumed that only a few marker components of gene subsets determine the type of a tissue. Here we present a new method for finding such groups of genes by directly incorporating the response variables into the grouping process, yielding a supervised clustering algorithm for genes.
Results: An empirical study on eight publicly available microarray datasets shows that our algorithm identifies gene clusters with excellent predictive potential, often superior to classification with state-of-the-art methods based on single genes. Permutation tests and bootstrapping provide evidence that the output is reasonably stable and more than a noise artifact.
Conclusions: In contrast to other methods such as hierarchical clustering, our algorithm identifies several gene clusters whose expression levels clearly distinguish the different tissue types. The identification of such gene clusters is potentially useful for medical diagnostics and may at the same time reveal insights into functional genomics.
Figures
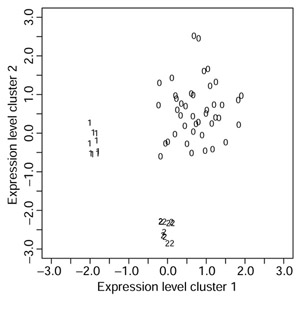
 shaped for the separation of response class 1 (FL), versus response classes 0 and 2 (DLBCL and CLL) on the x-axis, and
  formed for discrimination of class 2 versus classes 0 and 1 on the y-axis.
References
-
- Weinstein J, Myers T, O'Connor P, Friend H, Fornace A, Jr, Kohn K, Fojo T, Bates S, Rubinstein L, Anderson N, et al. An information-intensive approach to the molecular pharmacology of cancer. Science. 1997;275:343–349. - PubMed
-
- Ben-Dor A, Shamir R, Yakhini Z. Clustering gene expression patterns. J Comput Biol. 1999;6:281–297. - PubMed
Publication types
MeSH terms
LinkOut - more resources
Full Text Sources
Other Literature Sources
