

Identification of frequent cytogenetic aberrations in hepatocellular carcinoma using gene-expression microarray data
- PMID: 12537564
- PMCID: PMC151177
- DOI: 10.1186/gb-2002-3-12-research0075
Identification of frequent cytogenetic aberrations in hepatocellular carcinoma using gene-expression microarray data
Abstract
Background: Hepatocellular carcinoma (HCC) is a leading cause of death worldwide. Frequent cytogenetic abnormalities that occur in HCC suggest that tumor-modifying genes (oncogenes or tumor suppressors) may be driving selection for amplification or deletion of these particular genetic regions. In many cases, however, the gene(s) that drive the selection are unknown. Although techniques such as comparative genomic hybridization (CGH) have traditionally been used to identify cytogenetic aberrations, it might also be possible to identify them indirectly from gene-expression studies. A technique we have called comparative genomic microarray analysis (CGMA) predicts regions of cytogenetic change by searching for regional gene-expression biases. CGMA was applied to HCC gene-expression profiles to identify regions of frequent cytogenetic change and to identify genes whose expression is misregulated within these regions.
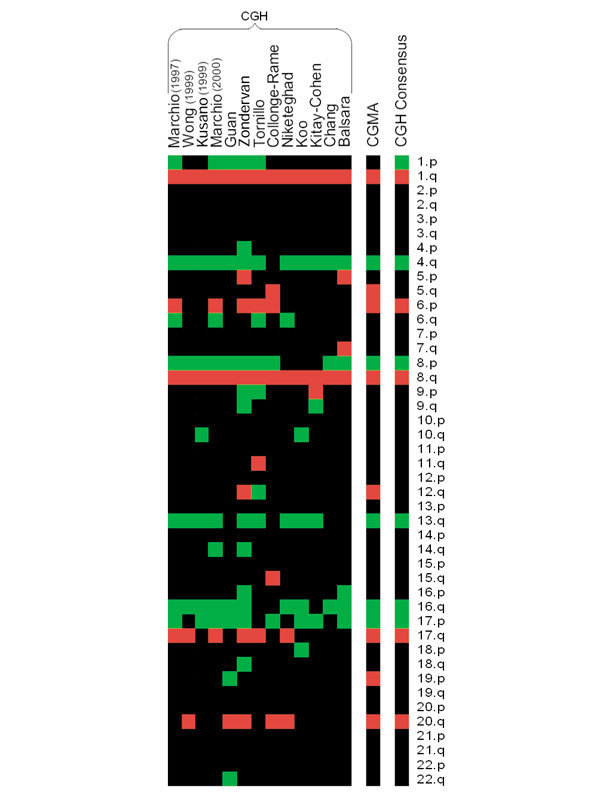
Results: Using CGMA, 104 HCC gene-expression microarray profiles were analyzed. CGMA identified 13 regions of frequent cytogenetic change in the HCC samples. Ten of these regions have been detected in previous CGH studies (+lq, -4q, +6p, -8p, +8q, -13q, -16q, -17p, +17q, +20q). CGMA identified three additional regions that have not been previously identified by CGH (+5q, +12q, +19p). Genes located in regions of frequent cytogenetic change were examined for changed expression in the HCC samples.
Conclusions: Our results suggest that CGMA predictions using gene-expression microarray datasets are a practical alternative to CGH profiling. In addition, CGMA might be useful for identifying candidate genes within cytogenetically abnormal regions.
Figures


References
-
- Kallioniemi A, Kallioniemi OP, Sudar D, Rutovitz D, Gray JW, Waldman F, Pinkel D. Comparative genomic hybridization for molecular cytogenetic analysis of solid tumors. Science. 1992;258:818–821. - PubMed
-
- Virtaneva K, Wright FA, Tanner SM, Yuan B, Lemon WJ, Caligiuri MA, Bloomfield CD, de La Chapelle A, Krahe R. Expression profiling reveals fundamental biological differences in acute myeloid leukemia with isolated trisomy 8 and normal cytogenetics. Proc Natl Acad Sci USA. 2001;98:1124–1129. doi: 10.1073/pnas.98.3.1124. - DOI - PMC - PubMed
-
- Phillips JL, Hayward SW, Wang Y, Vasselli J, Pavlovich C, Padilla-Nash H, Pezullo JR, Ghadimi BM, Grossfeld GD, Rivera A, et al. The consequences of chromosomal aneuploidy on gene expression profiles in a cell line model for prostate carcinogenesis. Cancer Res. 2001;61:8143–8149. - PubMed
-
- Monni O, Barlund M, Mousses S, Kononen J, Sauter G, Heiskanen M, Paavola P, Avela K, Chen Y, Bittner ML, Kallioniemi A. Comprehensive copy number and gene expression profiling of the 17q23 amplicon in human breast cancer. Proc Natl Acad Sci USA. 2001;98:5711–5716. doi: 10.1073/pnas.091582298. - DOI - PMC - PubMed
-
- Platzer P, Upender MB, Wilson K, Willis J, Lutterbaugh J, Nosrati A, Willson JK, Mack D, Ried T, Markowitz S. Silence of chromosomal amplifications in colon cancer. Cancer Res. 2002;62:1134–1138. - PubMed
Publication types
MeSH terms
LinkOut - more resources
Full Text Sources
Other Literature Sources
Medical
