. 2002;3(12):RESEARCH0083.
doi: 10.1186/gb-2002-3-12-research0083. Epub 2002 Dec 31.

Annotation of the Drosophila melanogaster euchromatic genome: a systematic review

Affiliations

Annotation of the Drosophila melanogaster euchromatic genome: a systematic review

Sima Misra et al. Genome Biol. 2002.

Abstract

Background: The recent completion of the Drosophila melanogaster genomic sequence to high quality and the availability of a greatly expanded set of Drosophila cDNA sequences, aligning to 78% of the predicted euchromatic genes, afforded FlyBase the opportunity to significantly improve genomic annotations. We made the annotation process more rigorous by inspecting each gene visually, utilizing a comprehensive set of curation rules, requiring traceable evidence for each gene model, and comparing each predicted peptide to SWISS-PROT and TrEMBL sequences.

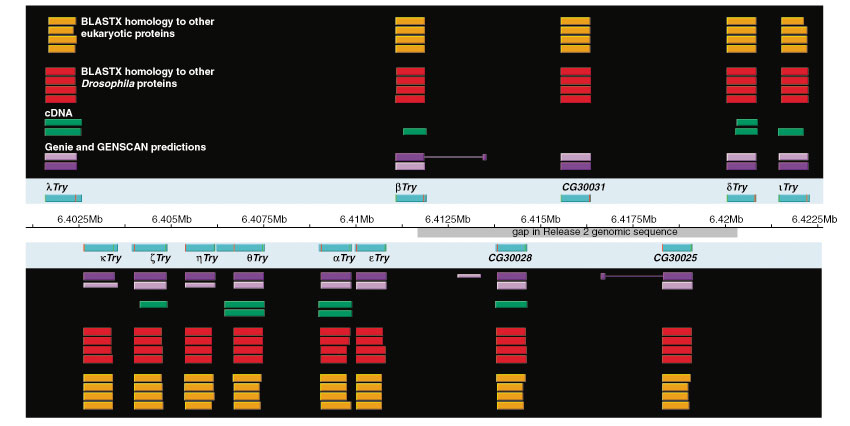
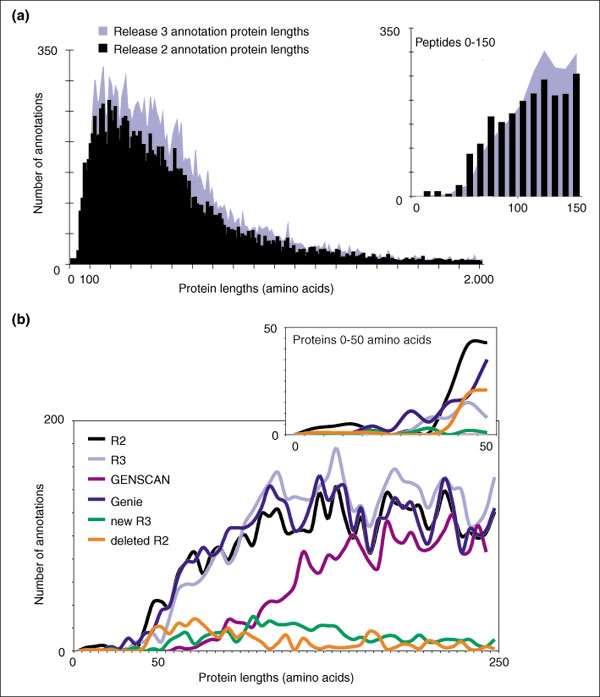
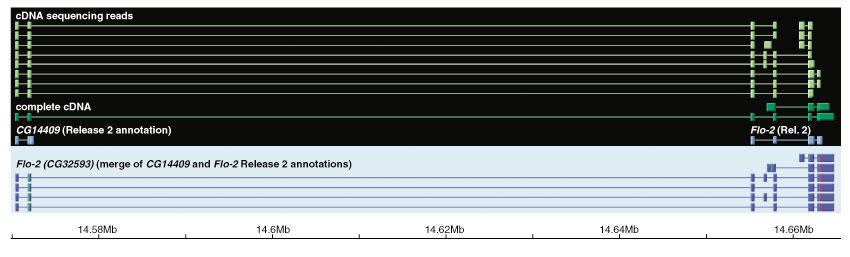
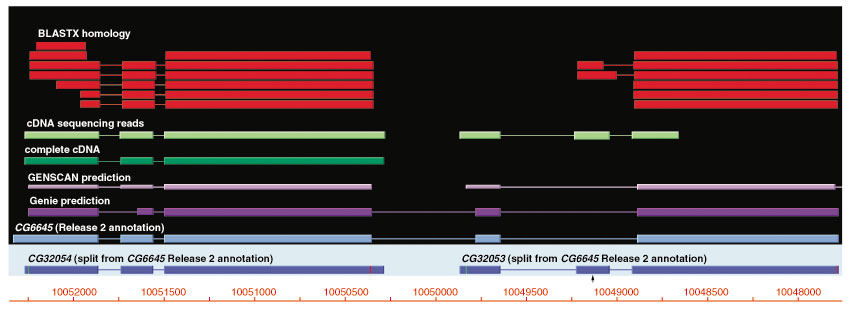
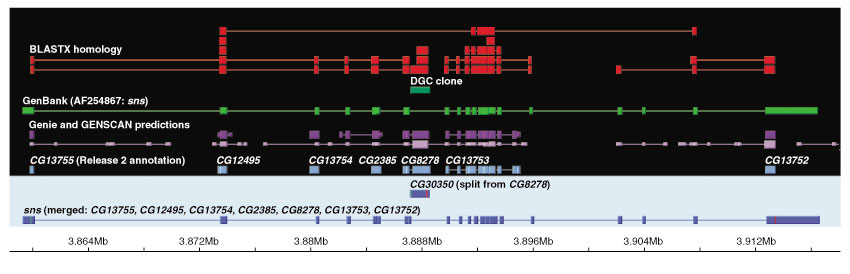
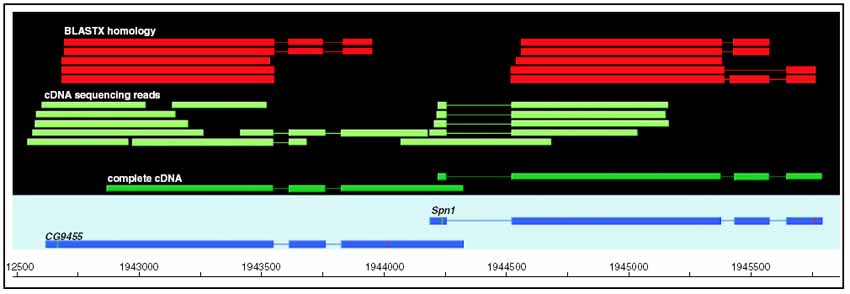
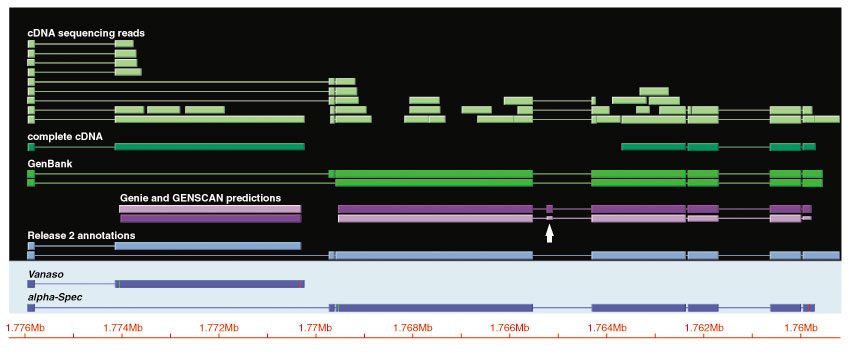
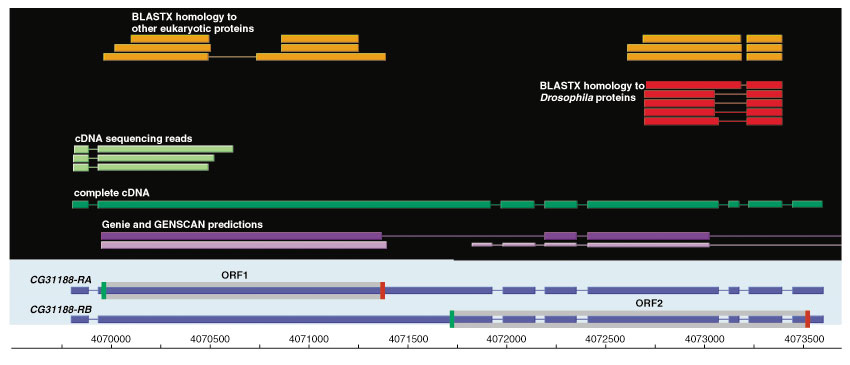
Results: Although the number of predicted protein-coding genes in Drosophila remains essentially unchanged, the revised annotation significantly improves gene models, resulting in structural changes to 85% of the transcripts and 45% of the predicted proteins. We annotated transposable elements and non-protein-coding RNAs as new features, and extended the annotation of untranslated (UTR) sequences and alternative transcripts to include more than 70% and 20% of genes, respectively. Finally, cDNA sequence provided evidence for dicistronic transcripts, neighboring genes with overlapping UTRs on the same DNA sequence strand, alternatively spliced genes that encode distinct, non-overlapping peptides, and numerous nested genes.

Conclusions: Identification of so many unusual gene models not only suggests that some mechanisms for gene regulation are more prevalent than previously believed, but also underscores the complex challenges of eukaryotic gene prediction. At present, experimental data and human curation remain essential to generate high-quality genome annotations.


Figures

Figure 1
Figure 1
A resolved misassembly from Release 2 sequence contains new trypsin genes. This illustration and Figures 3,4,5,6,7,8 are derived from the output of the graphical annotation tool Apollo [19], but these illustrations are not intended to be a direct representation of the data used to annotate the regions. Only evidence (shown in the black panels) directly used to annotate the gene models (shown in the cyan panels) are depicted in these illustrations. The plus strand is shown above the center scale, the minus strand below the center scale. Thin lines represent introns and thick boxes represent exons. Vertical green lines in the exons represent start codons and vertical red lines represent stop codons. An 8.5-kb region of genomic sequence on chromosome arm 2R was missing in Release 2 because of an apparent misassembly that incorrectly joined two tandemly repeated trypsin genes with a concomitant deletion of the intervening sequence (region shown in gray in the center scale). The missing sequence constituted an inverted repeat of 4 kb bordered by a simple repetitive sequence (S.C., unpublished results). Resolution of this error in Release 3 has led to the annotation of three new trypsin genes (blue rectangles): CG30025 (similar to βTry), CG30028 (similar to γδTry), and CG30031 (similar to γδTry). Gene-prediction data (dark purple for Genie and lavender for GENSCAN), cDNA data (dark green), and BLASTX protein similarity (red for Drosophila proteins, orange for other species' proteins) support the new trypsin genes.
Figure 2
Figure 2
Distribution of predicted peptide lengths in Release 2 and 3. (a) Comparison of protein lengths less than 2,000 amino acids shows that overall, Release 3 proteins of all lengths (blue) are more numerous than those in Release 2 (black). One exception is those proteins shorter than 100 amino acids: because of stricter data requirements for Release 3 annotations, some small Release 2 annotations were not preserved (inset). (b) Comparison of Release 2 (black) and 3 (light blue) protein lengths with predictions by GENSCAN (purple) and Genie (dark blue). Also shown are the lengths of proteins that were deleted (orange) or added (green) in Release 3. Of note is the underprediction of genes expressing small proteins by the program GENSCAN (purple).
Figure 3
Figure 3
Release 2 annotations CG14409 and Flo-2 (CG11547) were merged to create an expanded Flo-2 (CG32593) gene model. Only evidence (black panel) directly used to annotate the gene model (cyan panel) is shown. Alignments of ESTs and cDNA sequence reads (light green) and an assembled full-insert cDNA clone sequence (dark green) support the merger of the Release 2 annotation CG14409 (light blue) and the adjacent gene, Flo-2 (light blue), on the X chromosome. The expanded Release 3 Flo-2 annotation (dark blue) was assigned the new annotation number CG32593 to reflect this significant change. Predicted exons derived from a single cDNA clone are joined by thin horizontal lines, indicating introns. Predicted exons not so joined derive from different cDNA clones. Distance along the chromosome arm is shown in the scale at the bottom; the scale is black to denote the location of these annotations on the plus strand. Although the lowermost two transcripts appear to be duplications of other transcripts, they contain a slight variation in their 5' exon that is not visible at the scale used in this figure.
Figure 4
Figure 4
The Release 2 annotation CG6645 was split to create CG32054 and CG32053. Only evidence (black panel) directly used to annotate the gene models (cyan panel) is shown. While Release 2 annotation CG6645 on chromosome arm 2L consisted of a single long transcript (light blue), review of assembled EST and cDNA sequencing reads (light green) and BLASTX evidence (red) led to the creation of two smaller Release 3 annotations from the two halves of the original gene model. These new annotations (dark blue) were designated CG32054 and CG32053. Although the Genie prediction (purple data on black panel) supports a single coding transcript, the remaining data were judged to be stronger evidence of two separate genes. Note that for CG32053, the second exon was not included in either gene prediction, and was added on the basis of on cDNA sequencing read and BLASTX evidence (arrow). The chromosome scale at the bottom is red to denote the location of these annotations on the minus strand.
Figure 5
Figure 5
Complex split/merge creates updated sns annotation and new annotation CG30350. Only evidence (black panel) directly used to annotate the gene models (cyan panel) is shown. Occasionally, annotation of a particular region required complex rearrangement of the exons comprising the Release 2 gene models. In this case, the second exon of the Release 2 annotation CG8278 (light blue) was split off as a new gene (CG30350, dark blue) on the strength of DGC cDNA data (dark green) and BLASTX evidence (red). The remaining exon of CG8278, along with six other Release 2 annotations (CG13755, CG12495, CG13754, CG2385, CG13753, and CG13752; light blue), were merged together into the large sns gene (dark blue), strongly supported by sequence of a full-length sns cDNA, GenBank:AF254867.
Figure 6
Figure 6
The 3' UTR of CG9455 overlaps the downstream gene Spn1. Only evidence (black panel) directly used to annotate the gene models (cyan panel) is shown. This example of tandem overlapping genes is supported by full-insert cDNA sequences (dark green) and assembled EST and cDNA sequencing reads (light green). The 3' UTR of the CG9455 transcript (dark blue) extends past the initiation site of the Spn1 transcript (dark blue). BLASTX data (red) demonstrate that these transcripts encode independent proteins.
Figure 7
Figure 7
Vanaso and α-Spec are separate annotations that share an untranslated 5' exon. Only evidence (black panel) directly used to annotate the gene models (cyan panel) is shown. Coding sequences are delineated by green vertical lines (starts of translation) and red vertical lines (stops of translation). The Release 3 annotations Vanaso and α-Spec (dark blue) on chromosome arm 3L overlap at their most distal 5' end, sharing a portion of their untranslated regions. These gene models are supported by many ESTs and cDNA sequencing reads (light green), a complete cDNA clone (dark green), and several GenBank records (dark green). In spite of the shared initiation point for these transcripts, none of the remaining exons or coding sequences coincides. Note the small exon (arrow) predicted by Genie and GENSCAN. This exon is not included in the α-Spec annotation, for lack of other supporting evidence, but alternative cDNA clones including this exon will be screened for directly in cDNA libraries [30].
Figure 8
Figure 8
CG31188 is a dicistronic gene. Data directly used to annotate the dicistronic gene model are shown in the black panel and the gene models generated from these data are shown in the cyan panel. Coding sequences are delineated by green vertical lines (starts of translation) and red vertical lines (stops of translation). Dicistronic genes (dark blue) were predicted when assembled cDNA sequencing reads or complete cDNA sequence (light and dark green) span two complete open reading frames (ORF1 and ORF2, shaded in cyan panel) that are separated by in-frame stop codons. There must be additional evidence supporting the existence of both predicted peptides. In the case of CG31188 on chromosome arm 3R, each of the two ORFs shares homology with proteins from other eukaryotes (orange) or Drosophila (red).

References

    1. The FlyBase Consortium The FlyBase database of the Drosophila genome projects and community literature. Nucleic Acids Res. 2002;30:106–108. - PMC - PubMed
    1. FlyBase: a database of the Drosophila Genome http://www.flybase.org
    1. Adams MD, Celniker SE, Holt RA, Evans CA, Gocayne JD, Amanatides PG, Scherer SE, Li PW, Hoskins RA, Galle RF, et al. The genome sequence of Drosophila melanogaster. Science. 2000;287:2185–2195. - PubMed
    1. Rubin GM, Yandell MD, Wortman JR, Gabor Miklos GL, Nelson CR, Hariharan IK, Fortini ME, Li PW, Apweiler R, Fleischmann W, et al. Comparative genomics of the eukaryotes. Science. 2000;287:2204–2215. - PMC - PubMed
    1. Rubin GM, Hong L, Brokstein P, Evans-Holm M, Frise E, Stapleton M, Harvey DA. A Drosophila complementary DNA resource. Science. 2000;287:2222–2224. - PubMed

Publication types