Comparative Study
. 2002;3(12):RESEARCH0084.
doi: 10.1186/gb-2002-3-12-research0084. Epub 2002 Dec 23.

The transposable elements of the Drosophila melanogaster euchromatin: a genomics perspective

Affiliations
Comparative Study

The transposable elements of the Drosophila melanogaster euchromatin: a genomics perspective

Joshua S Kaminker et al. Genome Biol. 2002.

Abstract

Background: Transposable elements are found in the genomes of nearly all eukaryotes. The recent completion of the Release 3 euchromatic genomic sequence of Drosophila melanogaster by the Berkeley Drosophila Genome Project has provided precise sequence for the repetitive elements in the Drosophila euchromatin. We have used this genomic sequence to describe the euchromatic transposable elements in the sequenced strain of this species.

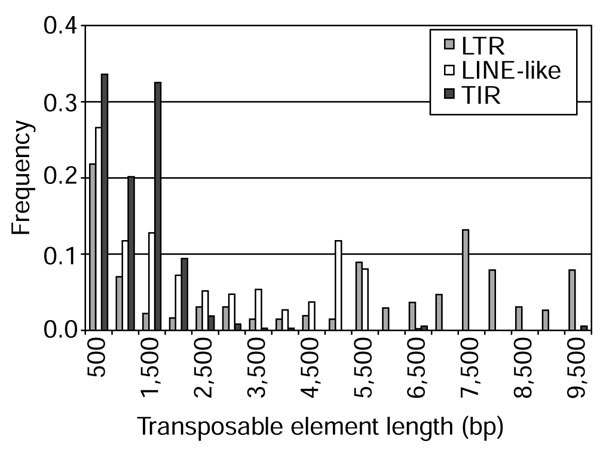
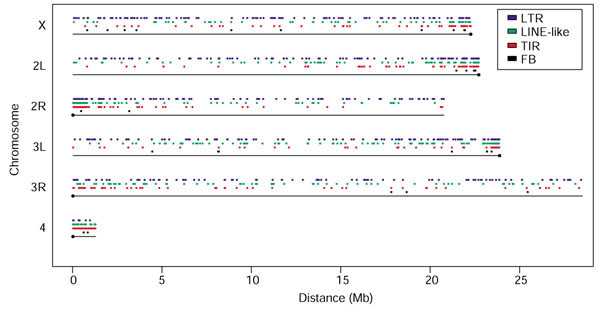
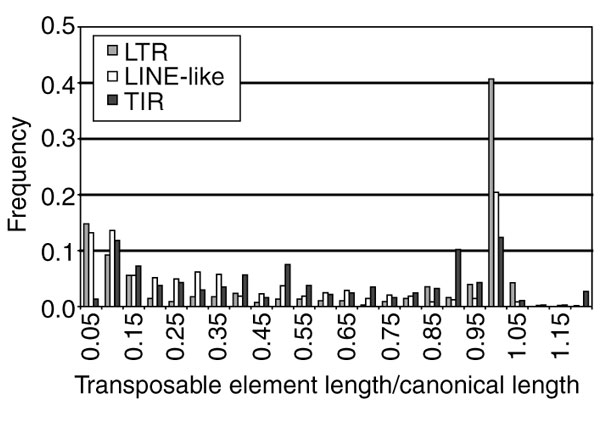
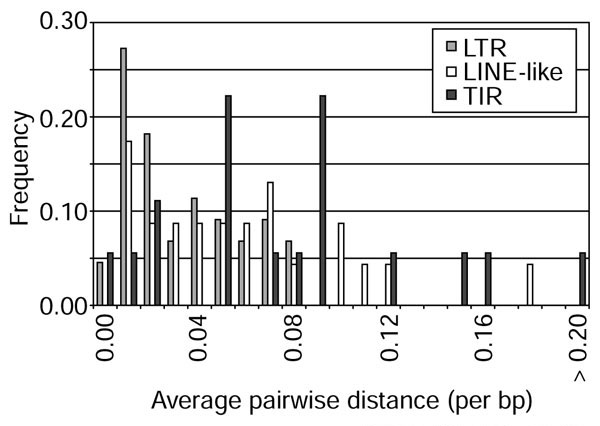
Results: We identified 85 known and eight novel families of transposable element varying in copy number from one to 146. A total of 1,572 full and partial transposable elements were identified, comprising 3.86% of the sequence. More than two-thirds of the transposable elements are partial. The density of transposable elements increases an average of 4.7 times in the centromere-proximal regions of each of the major chromosome arms. We found that transposable elements are preferentially found outside genes; only 436 of 1,572 transposable elements are contained within the 61.4 Mb of sequence that is annotated as being transcribed. A large proportion of transposable elements is found nested within other elements of the same or different classes. Lastly, an analysis of structural variation from different families reveals distinct patterns of deletion for elements belonging to different classes.

Conclusions: This analysis represents an initial characterization of the transposable elements in the Release 3 euchromatic genomic sequence of D. melanogaster for which comparison to the transposable elements of other organisms can begin to be made. These data have been made available on the Berkeley Drosophila Genome Project website for future analyses.


Figures

Figure 1
Figure 1
Frequency distribution of transposable element lengths in the Drosophila genome. Plotted are the lengths (in bp) of individual elements by functional class: LTR (gray), LINE-like (white), and TIR (black). Pairwise tests among all three classes (LTR versusLINE-like, LTRversusTIR, and LINE-like versus TIR) reveal that the distribution of individual element lengths differ significantly between functional classes (Mann-Whitney U test, p < 1 × 10⁻⁶).
Figure 2
Figure 2
Distribution of transposable elements along chromosome arms. For each chromosome arm, the centromeres are indicated by circles. Each colored tick marks the start coordinate of an element belonging to one of the four classes of element (see key). Note the large number of LTR elements (blue) relative to the other classes on the major chromosome arms, and the higher number of LINE-like (green) and TIR (red) elements relative to the number of LTR elements seen for chromosome 4. While there is a relatively even distribution of transposable elements throughout the majority of each arm, there is a significant increase in the density of all classes of element in the proximal euchromatin (see also Table 1).
Figure 3
Figure 3
Frequency distribution of transposable element lengths scaled relative to their canonical lengths. Plotted are the scaled lengths of individual elements by functional class: LTR (gray), LINE-like (white), and TIR (black). Mann-Whitney U tests among all three classes (LTR versus LINE-like, LTRversusTIR, and LINE-like versus TIR) reveal that the distribution of scaled element lengths differ significantly between functional classes (Mann-Whitney U test, p < 1 × 10⁻⁴).
Figure 4
Figure 4
Structural variation within three common transposable elements: (a) jockey; (b) pogo; (c) roo. Multiple alignments generated from each respective family were used to approximate genomic variation. Each position along the length of the multiple alignment (x-axis) was measured for the presence of a nucleotide. The percentage of elements within an alignment that contained the nucleotide was determined and is indicated along the y-axis. A schematic drawing representing a jockey, pogo, or roo element is shown directly below each panel; coding regions are indicated by light-gray boxes and repeats (pogo and roo) are represented by black boxes.
Figure 5
Figure 5
Frequency distribution of within-family average pairwise distances. Plotted are average pairwise distances (per bp) for individual transposable element families by functional class. Mann-Whitney U tests reveal that intra-family average pairwise distances differ significantly between LTR families and LINE-like families (p < 0.005), and between LTR families and TIR families (p < 0.0005), but not between LINE-like and TIR families (p < 0.311).
Figure 6
Figure 6
Structural characteristics of DNA insertion sites. Sites for (a) roo; (b) pogo; (c) jockey. Genomic sequence flanking the insertion site of each element was extracted from our dataset. Those elements for which duplicated target sequences could not be identified were discarded. The remaining sequences from each family were centered on the repeat (vertical gray line) and the average denaturation temperature across all sequences was determined using a 3-bp window size. In each panel, the light horizontal gray line represents the average denaturation temperature of random genomic sequence and the horizontal black line represents the average denaturation temperature of the experimental set of sequences. The x-axis represents the distance (in bp) from the insertion site and the y-axis represents the temperature (°C). The sequences flanking the roo (a) and pogo (b) elements have opposite characteristics; the roo sequences have a higher than average denaturation temperature whereas the pogo sequences have a lower than average denaturation temperature. The average denaturation temperature of the sequence flanking the jockey elements does not differ from that of the random sequence.

Similar articles

Cited by

References

    1. Craig NL, Craigie R, Gellert M, Lambowitz AM, Eds Mobile DNA II Washington, DC: ASM Press; 2002.
    1. Green MM. Genetic instability in Drosophila melanogaster: Mutable miniature (mmu). Mutat Res. 1975;29:77–84. - PubMed
    1. Demerec M. Miniature-α - a second frequently mutating character in Drosophila virilis. Proc Natl Acad Sci USA. 1926;12:687–690. - PMC - PubMed
    1. Demerec M. Magenta-α - a third frequently mutating character in Drosophila virilis. Proc Natl Acad Sci USA. 1927;13:249–253. - PMC - PubMed
    1. Demerec M. Unstable genes. Bot Rev. 1935;1:233–248.

Publication types