Comparative Study
. 2002;3(12):RESEARCH0086.
doi: 10.1186/gb-2002-3-12-research0086. Epub 2002 Dec 30.

Assessing the impact of comparative genomic sequence data on the functional annotation of the Drosophila genome

Affiliations
Comparative Study

Assessing the impact of comparative genomic sequence data on the functional annotation of the Drosophila genome

Casey M Bergman et al. Genome Biol. 2002.

Abstract

Background: It is widely accepted that comparative sequence data can aid the functional annotation of genome sequences; however, the most informative species and features of genome evolution for comparison remain to be determined.

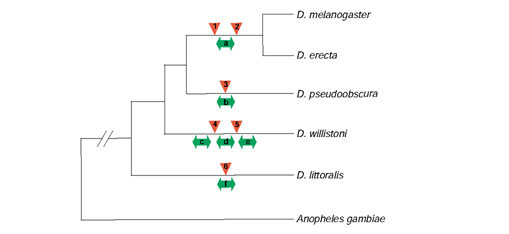
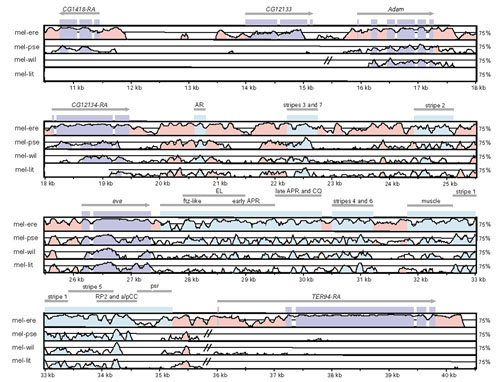
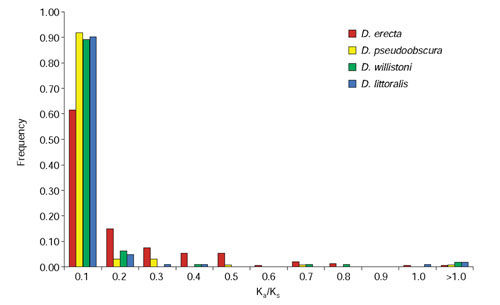
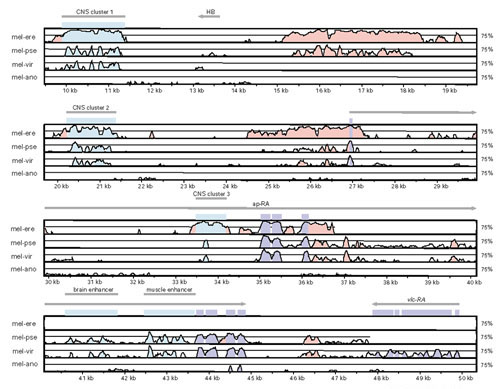
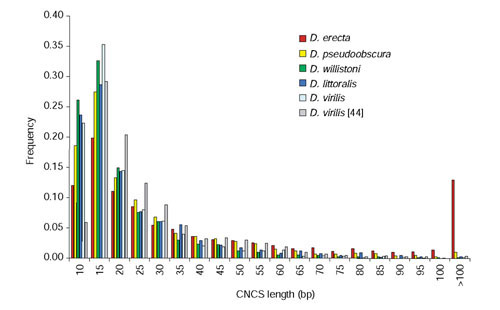
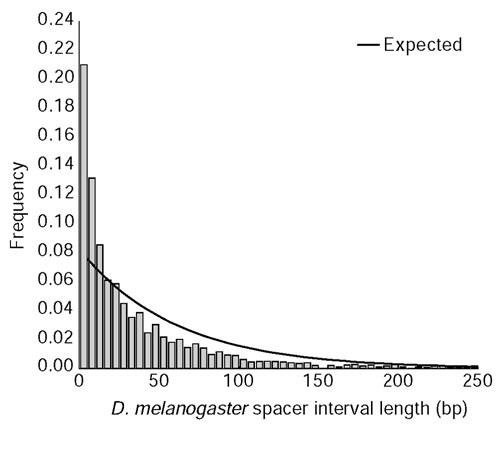
Results: We analyzed conservation in eight genomic regions (apterous, even-skipped, fushi tarazu, twist, and Rhodopsins 1, 2, 3 and 4) from four Drosophila species (D. erecta, D. pseudoobscura, D. willistoni, and D. littoralis) covering more than 500 kb of the D. melanogaster genome. All D. melanogaster genes (and 78-82% of coding exons) identified in divergent species such as D. pseudoobscura show evidence of functional constraint. Addition of a third species can reveal functional constraint in otherwise non-significant pairwise exon comparisons. Microsynteny is largely conserved, with rearrangement breakpoints, novel transposable element insertions, and gene transpositions occurring in similar numbers. Rates of amino-acid substitution are higher in uncharacterized genes relative to genes that have previously been studied. Conserved non-coding sequences (CNCSs) tend to be spatially clustered with conserved spacing between CNCSs, and clusters of CNCSs can be used to predict enhancer sequences.

Conclusions: Our results provide the basis for choosing species whose genome sequences would be most useful in aiding the functional annotation of coding and cis-regulatory sequences in Drosophila. Furthermore, this work shows how decoding the spatial organization of conserved sequences, such as the clustering of CNCSs, can complement efforts to annotate eukaryotic genomes on the basis of sequence conservation alone.


Figures

Figure 1
Figure 1
Phylogenetic relationships of the five Drosophila species studied in this paper and the outgroup species, the mosquito Anopheles gambiae. The topology of this tree is based on the accepted relationship of these six species; the divergence times from D. melanogaster are approximately 6-15, 46, 53, 61-65, and 250 million years for D. erecta, D. pseudoobscura, D. willistoni, D. littoralis and A. gambiae, respectively [7,84]. D. melanogaster, D. erecta, D. pseudoobscura and D. willistoni belong to the subgenus Sophophora and D. littoralis belongs to the subgenus Drosophila. Rearrangements are indicated by double-headed arrows below each branch and gene transpositions are indicated by triangles above each branch. Rearrangements are inferred to occur on the lineages leading to (a) the ancestor of the D. melanogaster/D. erecta eve region, (b) the D. pseudoobscura Rh1 region, the D. willistoni (c) eve, (d) Rh1, and (e) Rh3 regions, and (f) the D. littoralis ftz region. Gene transpositions are inferred to occur for the (1) CG13029 and (2) CG12133 genes in the ancestor of the D. melanogaster/D. erecta lineage, (3) the CG5245-like gene in the D. pseudoobscura lineage, (4) the CG8319-like gene in the D. willistoni lineage, (5) the CG2222-like gene in the D. willistoni lineage, and (6) the Rh4 gene in the D. littoralis lineage. We note that the event classified as a rearrangement involving the D. pseudoobscura CG31155 gene at the end of the Rh1 clone may be a gene transposition as this gene is a partial gene spanning the edge of the clone. In addition, we note that rearrangement involving the D. littoralis ftz gene may have occurred on the branch leading to the ancestor of the Sophophoran species since, although the orientation of ftz with respect to Antp is ambiguous in A. gambiae ([85,86] and data not shown), it shares a similar configuration to D. littoralis in the outgroup, Tribolium castaneum [87].
Figure 2
Figure 2
VISTA plot of genome organization and sequence conservation in the Drosophila eve region. Sequences were aligned using AVID, and conserved sequences were visualized using default parameters of VISTA. From top to bottom are pairwise comparisons between D. melanogaster and D. erecta (mel-ere), D. pseudoobscura (mel-pse), D. willistoni (mel-wil) and D. littoralis (mel-lit), respectively. In each panel, conserved segments from 50-100% are plotted, with the midline indicating 75% identity; regions with no midline represent sequences not sampled in a pairwise comparison. Double bars crossing a midline represent rearrangement breakpoints. The location and orientation of coding sequences are indicated by arrows; purple boxes represent coding exons and light-blue boxes represent functionally characterized cis-regulatory sequences [50,88,89,90]; pink regions represent uncharacterized CNCSs. Suffixes on gene names (for example, TER94-RA) indicate the particular transcript displayed for genes with multiple transcripts. Note that the predicted gene CG12133 is restricted to the D. melanogaster/D. erecta lineage but is absent in D. pseudoobscura, although both flanking genes are present.
Figure 3
Figure 3
Frequency distribution of Ka/Ks ratios for pairwise exon-level comparisons between D. melanogaster and either D. erecta, D. pseudoobscura, D. willistoni, or D. littoralis. Ka/Ks ratios were estimated using the codeml program of PAML 3.12 using runmode = -2.
Figure 4
Figure 4
VISTA plot of genome organization and sequence conservation in the Drosophila ap region. From top to bottom are pairwise comparisons between D. melanogaster and D. erecta (mel-ere), D. pseudoobscura (mel-pse), D. virilis (mel-vir) and A. gambiae (mel-ano), respectively. Features of this plot are as in Figure 3. Shown are five CNCS clusters corresponding to the muscle enhancer [91], the brain-specific enhancer empirically verified in this study (Figure 8), and three predicted enhancers labeled CNCS clusters 1, 2 and 3. Note that the HB transposable element in the region 5' to ap is located between CNCS clusters and is not conserved between species.
Figure 5
Figure 5
Frequency distribution of CNCS lengths in Drosophila species. The distributions of CNCS lengths are shown for comparisons between D. melanogaster and either D. erecta, D. pseudoobscura, D. willistoni or D. littoralis. CNCSs of 10 bp or greater with 90% or greater nucleotide identity were identified using VISTA. Also shown for comparison is a re-analysis of the length distribution of CNCSs between D. melanogaster and D. virilis using the current methods, as well as previous results for a sample of noncoding regions published in [44].
Figure 6
Figure 6
Frequency distribution of spacer interval lengths separating CNCSs between D. melanogaster and D. pseudoobscura. Plotted is a histogram of the length in D. melanogaster of 'nonconserved' spacer interval sequences between CNCSs identified using VISTA (10-bp window, 90% identity). Spacer intervals separating a CNCS and a conserved coding segment, or between two conserved coding segments were omitted from this analysis. Note that only spacer interval lengths less than 250 bp are displayed for clarity. Solid lines represent the expectation under an exponential distribution using an estimate of the rate parameter λ based on the inverse of the mean spacer interval length to be 0.0165. The null hypothesis that spacer interval lengths are exponentially distributed can be rejected (χ2 = 2,040.1, df = 30, p < 10-6), indicating that Drosophila CNCSs are non-randomly spaced.
Figure 7
Figure 7
Correlation of spacer interval lengths separating CNCSs between D. melanogaster and D. pseudoobscura. Each point represents the log10-transformed lengths for a homologous pair of spacer intervals. Spacer intervals separating a CNCS and a conserved coding segment, or between two conserved coding segments were omitted from this analysis. The solid line represents perfect spacer interval length conservation; the dashed lines represent order of magnitude size changes in spacer interval length between these two species. The correlation coefficient for homologous spacer interval lengths is r = 0.85 (p < 0.01).
Figure 8
Figure 8
Reporter gene expression driven by genomic sequences corresponding to the CNCS cluster in ap intron 4. Specific expression in the embryonic brain is driven by both (a) D. melanogaster and (b) D. virilis sequences, indicating that the function of this enhancer has been conserved in these two species.

References

    1. Lewontin RC, Moore JA, Provine WB, Wallace B, Eds . Dobzhansky's Genetics of Natural Populations I-XLIII. New York: Columbia University Press; 1981.
    1. Patterson JT, Stone WS. Evolution in the Genus Drosophila. New York: Macmillan; 1952.
    1. Lewontin RC, Hubby JL. A molecular approach to the study of genic heterozygosity in natural populations. II. Amount of variation and degree of heterozygosity in natural population of D. pseudoobscura. Genetics. 1966;54:595–609. - PMC - PubMed
    1. Kreitman M. Nucleotide polymorphism at the alcohol dehydrogenase locus of Drosophila melanogaster. Nature. 1983;304:412–417. - PubMed
    1. Blackman RK, Meselson M. Interspecific nucleotide sequence comparisons used to identify regulatory and structural features of the Drosophila hsp82 gene. J Mol Biol. 1986;188:499–515. - PubMed

Publication types

LinkOut - more resources