. 2003 Jan 20;197(2):181-93.
doi: 10.1084/jem.20020632.

Expression of ICOS in vivo defines CD4+ effector T cells with high inflammatory potential and a strong bias for secretion of interleukin 10

Affiliations

Expression of ICOS in vivo defines CD4+ effector T cells with high inflammatory potential and a strong bias for secretion of interleukin 10

Max Löhning et al. J Exp Med. .

Abstract

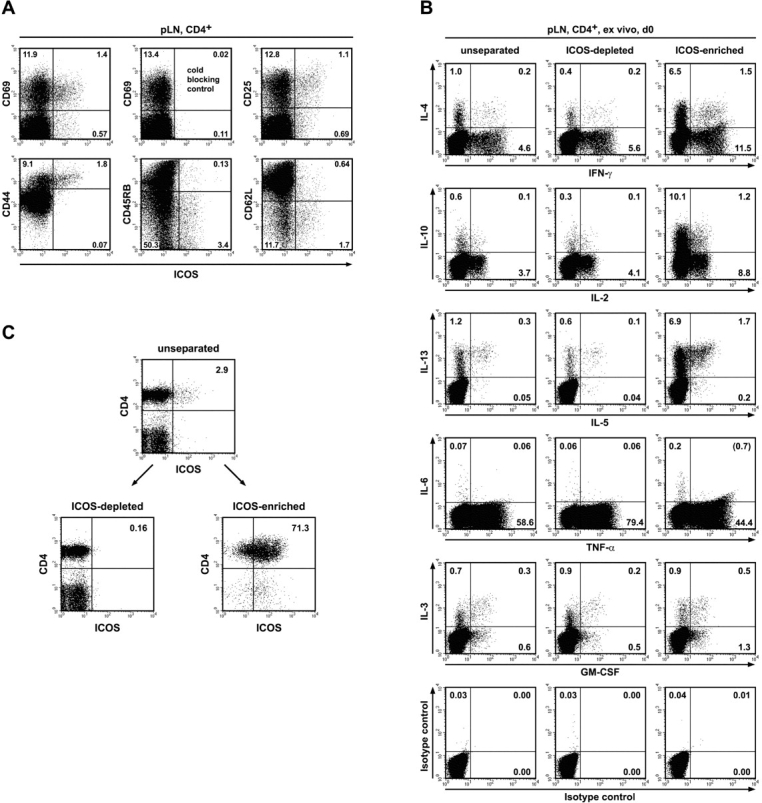
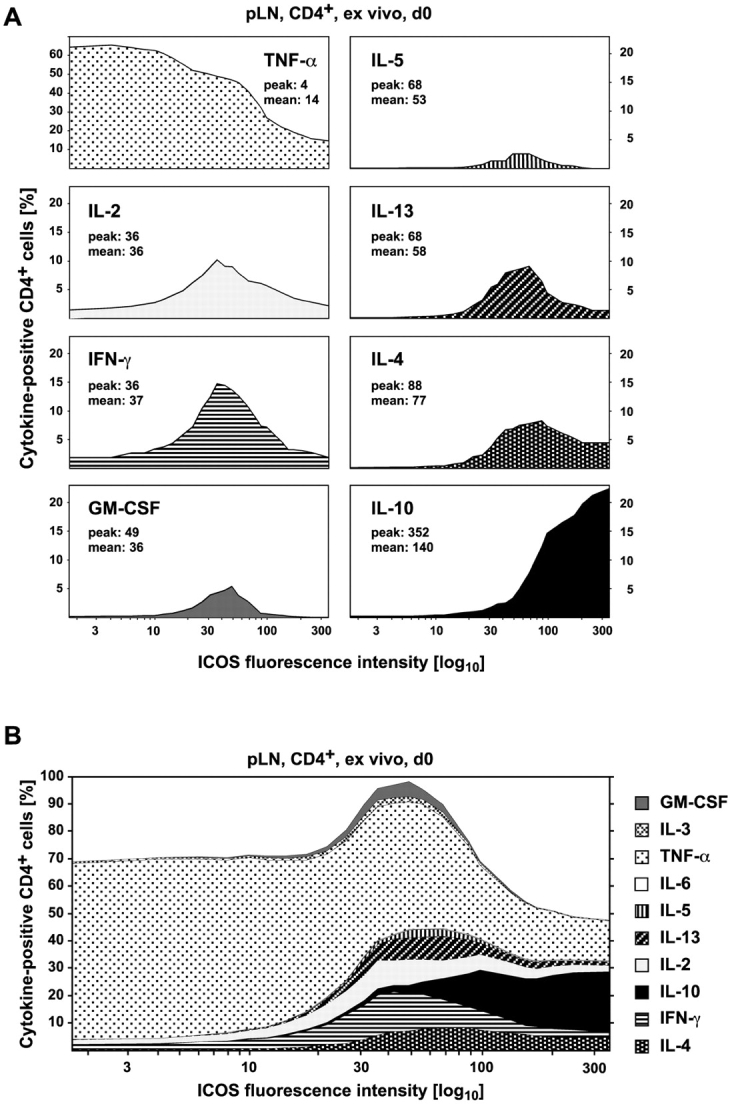
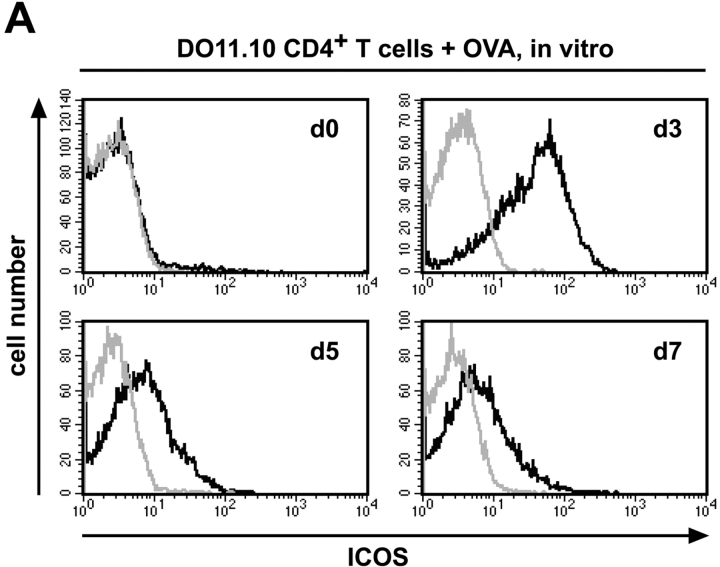
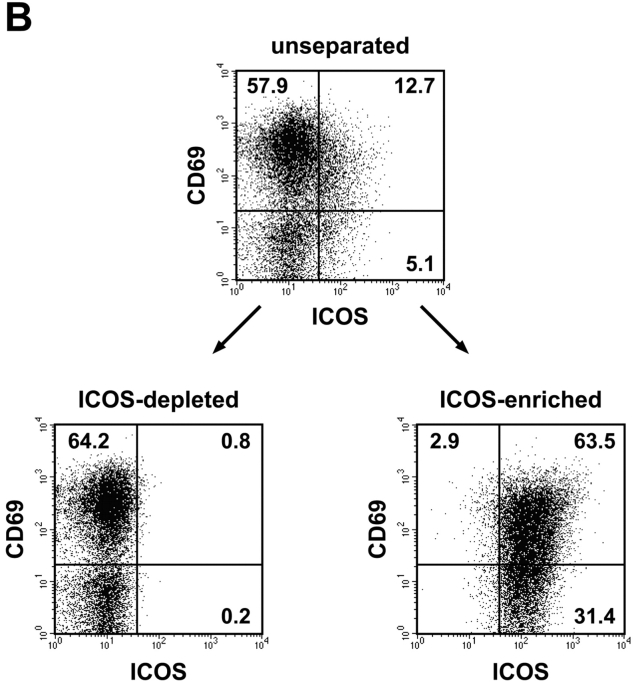
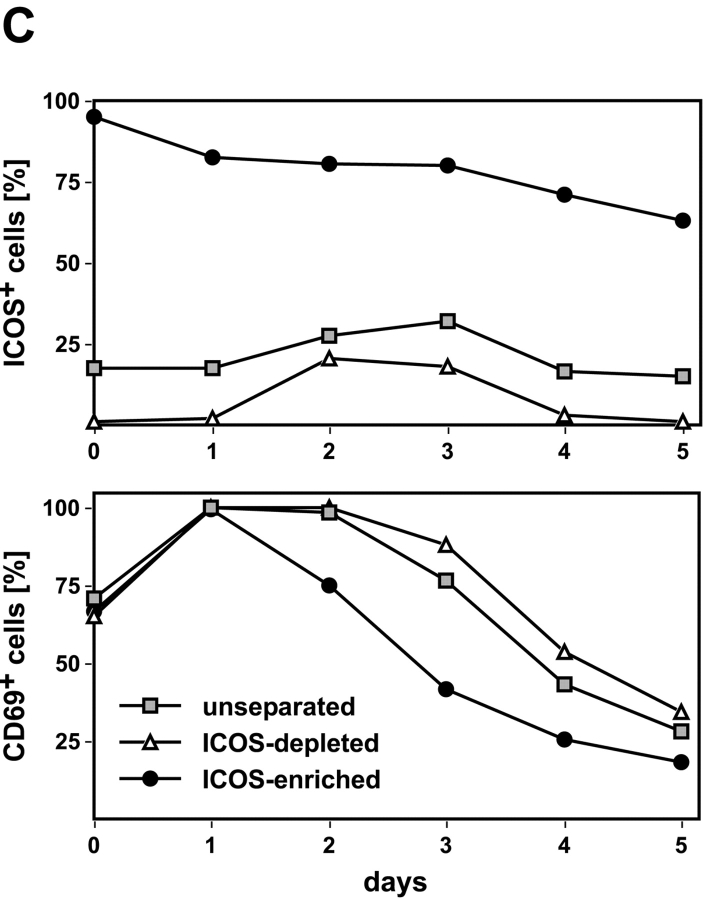
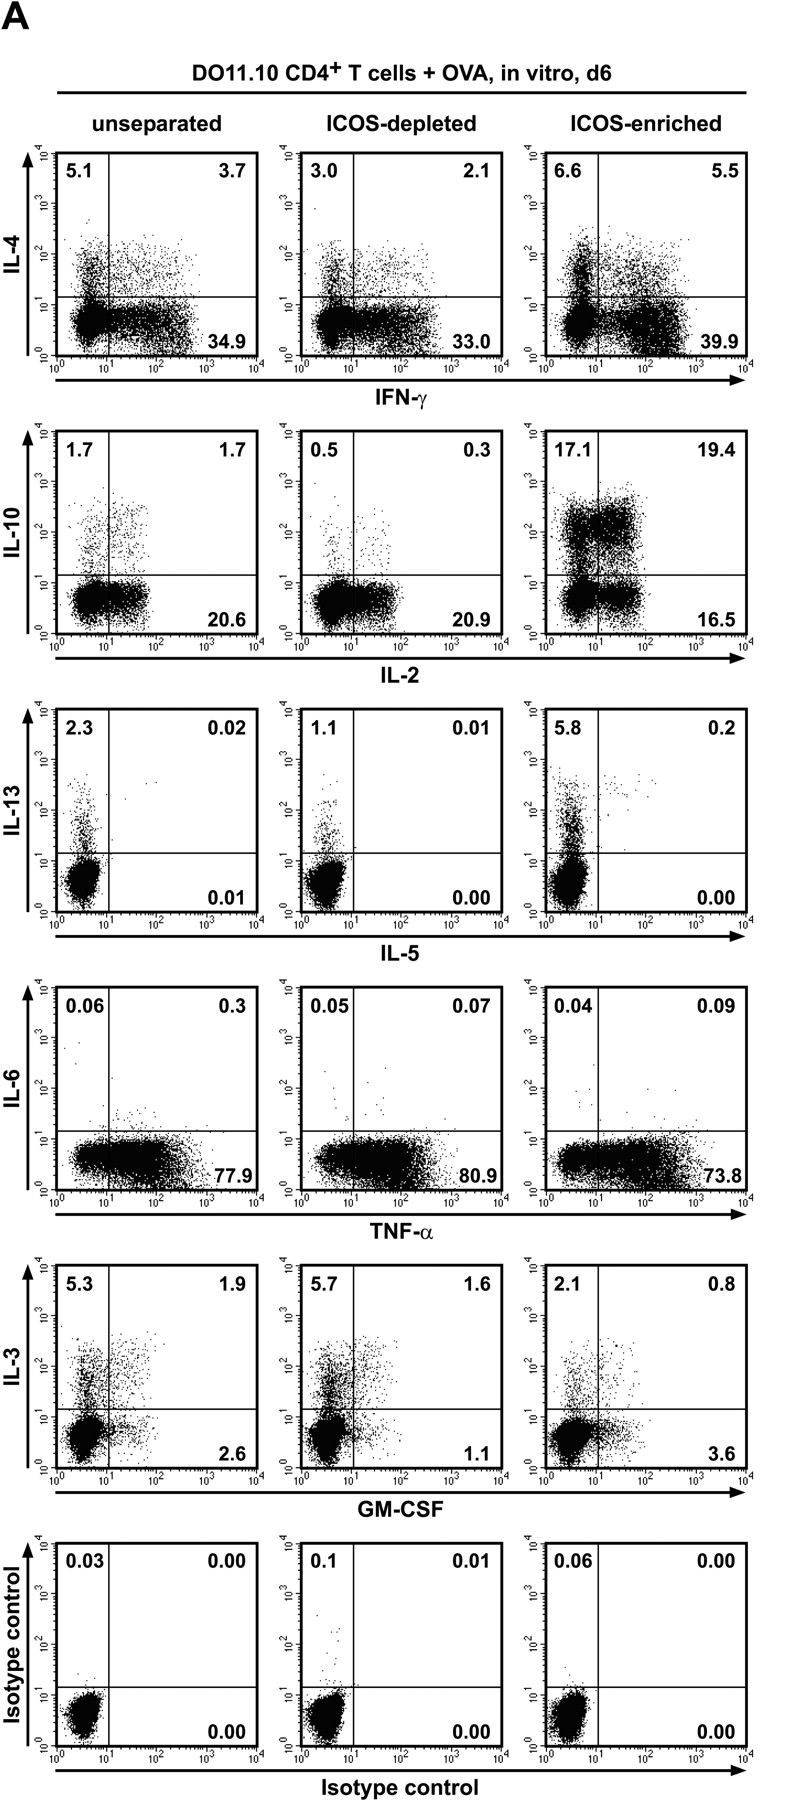
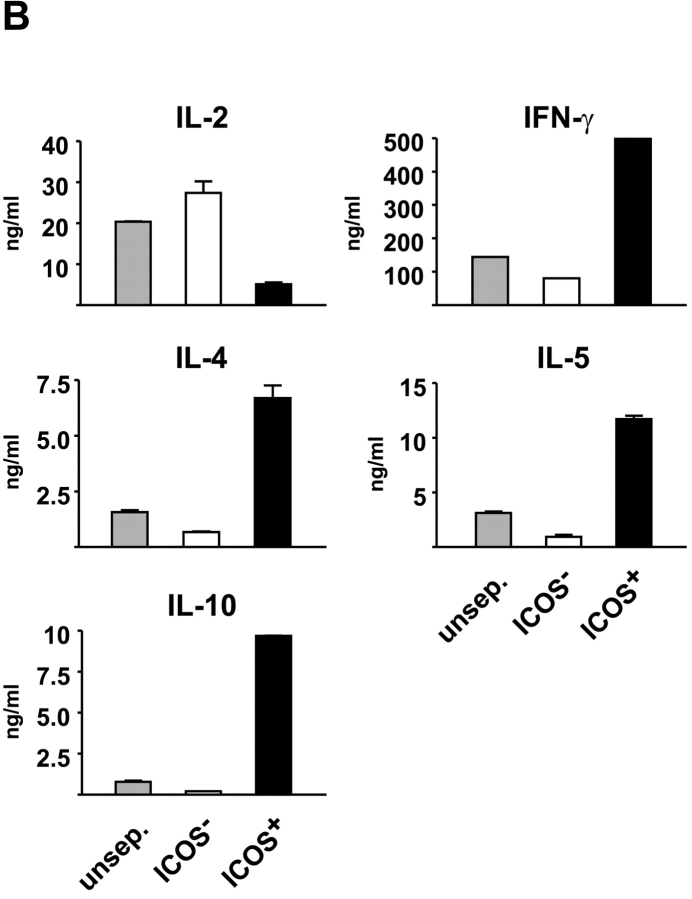
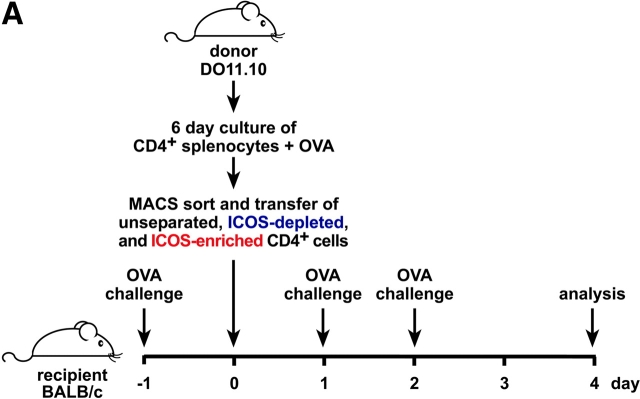
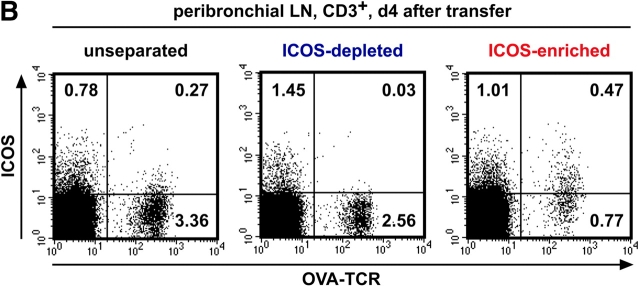
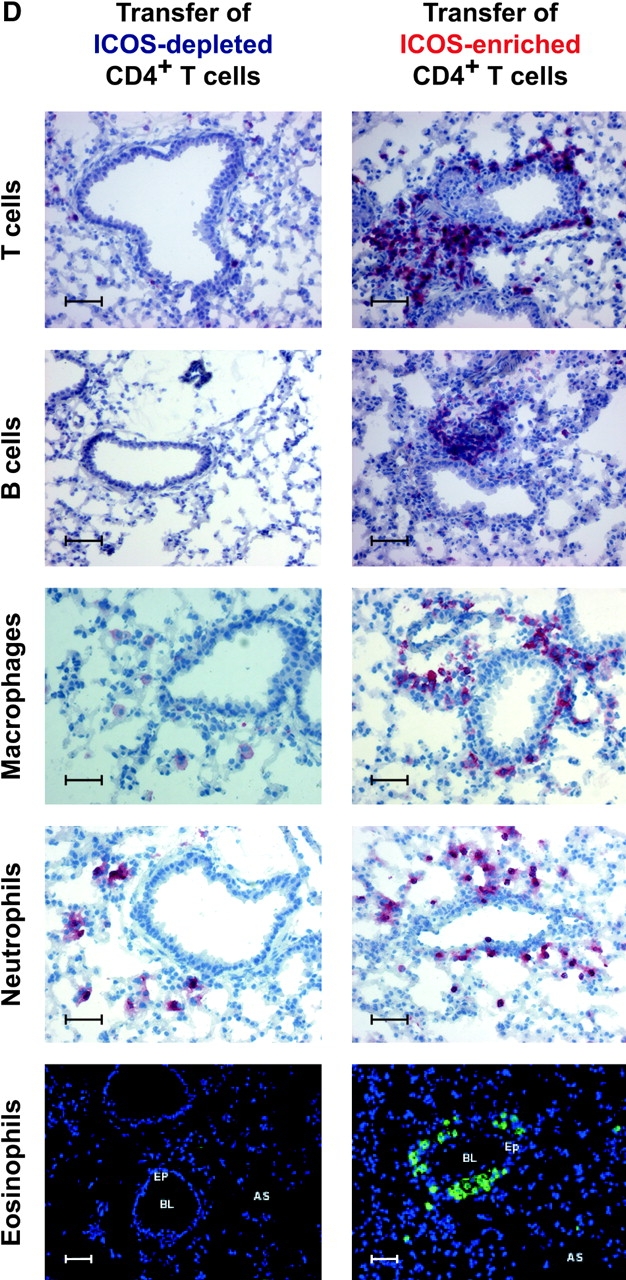
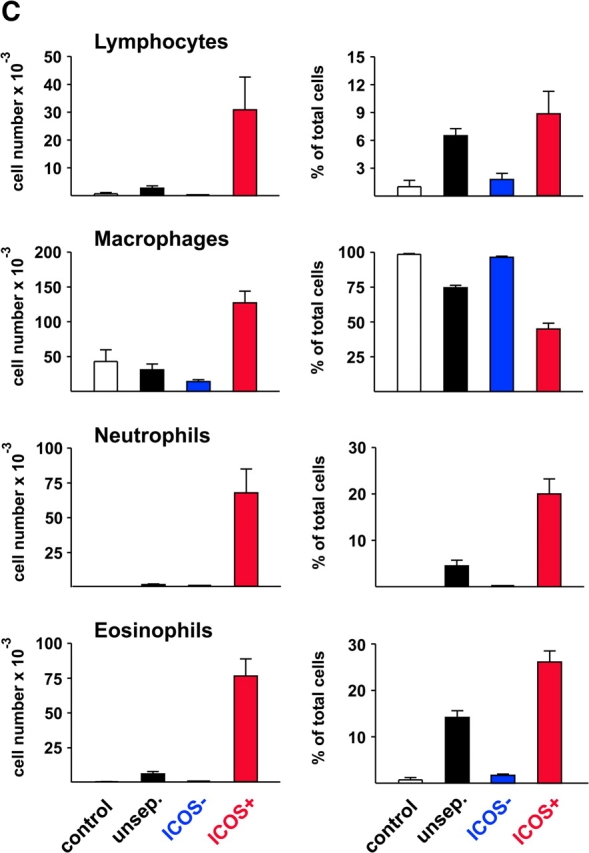
The studies performed to date analyzed the overall participation of the inducible costimulator (ICOS) in model diseases, but did not yield information on the nature and function of ICOS-expressing T cells in vivo. We examined ICOS(+) T cells in the secondary lymphoid organs of nonmanipulated mice, in the context of an "unbiased" immune system shaped by environmental antigens. Using single cell analysis, ICOS(low) cells were found to be loosely associated with the early cytokines interleukin (IL)-2, IL-3, IL-6, and interferon (IFN)-gamma. ICOS(medium) cells, the large majority of ICOS(+) T cells in vivo, were very tightly associated with the synthesis of the T helper type 2 (Th2) cytokines IL-4, IL-5, and IL-13, and these cells exhibited potent inflammatory effects in vivo. In contrast, ICOS(high) T cells were highly and selectively linked to the anti-inflammatory cytokine IL-10. Overall, these data seem to indicate that ICOS cell surface density serves as a regulatory mechanism for the release of cytokines with different immunological properties. Further in vivo functional experiments with in vitro-activated T cells strongly suggested that the ICOS(+) population, although representing in vivo only around 10% of T cells bearing early or late activation markers, nevertheless encompasses virtually all effector T cells, a finding with major diagnostic and therapeutic implications.


Figures

Figure 1.
Figure 1.
Phenotype and cytokine pattern of ICOS-expressing CD4+ T cells in vivo. (A) ICOS is expressed on a subpopulation of antigen-experienced CD4+ T cells in vivo. Cells from pLN of 6-mo-old BALB/c mice were stained with mAb against CD4, ICOS, and a panel of T cell activation markers, as indicated. In each case, the specificity of ICOS staining was controlled by preincubating the cells with an excess of unconjugated anti-ICOS mAb (cold blocking control, only shown for CD69 coexpression analysis). Analysis gates were set on live CD4+ T lymphocytes. The inserted numbers represent the net percentage of ICOS-positive and/or activation marker-positive CD4+ cells after subtraction of the respective cold-blocking controls. (B) ICOS expression on CD4+ T cells in vivo correlates with a Th2-biased, IL-10–dominated cytokine pattern. Unseparated, ICOS-depleted, and ICOS-enriched (compare panel C) pLN cells were stimulated with PMA and ionomycin for 5 h in the presence of Brefeldin A for the last 3 h. After fixation, cells were stained for CD4, and simultaneously for the indicated intracellular cytokines. The inserted numbers represent percentages of CD4+ cells generating a given cytokine. The results shown are representative of three independent experiments. (C) Separation of ex vivo T cells into ICOS-depleted and ICOS-enriched populations. Cells from pLN of BALB/c mice were stained with digoxigenized anti-ICOS mAb MIC-280, followed by anti-Dig MACS microbeads and anti-Dig-Cy5. The cells were separated by MACS and stained also for CD4. Similar numbers of CD4+ T cells of the unsorted and sorted fractions are shown. Percentages of ICOS+ cells in the CD4+ population are indicated. The specificity of enrichment for ICOS+ cells is reflected by the selective accumulation of CD4+ cells in the ICOS-enriched fraction.
Figure 2.
Figure 2.
The degree of ICOS cell surface expression on CD4+ T cells is correlated with the cytokine pattern secreted. Cells from pLN of BALB/c mice were stained for ICOS and sorted according to ICOS expression. Unseparated or ICOS-enriched cells were activated with PMA and ionomycin for 5 h in the presence of Brefeldin A for the last 3 h, stained for CD4 and various intracellular cytokines, and analyzed by flow cytometry. ICOS surface expression on CD4+ T cells, measured as relative fluorescence intensity, was correlated to the percentage of cells capable of secreting a given cytokine. The percentage of CD4+ T cells secreting the indicated cytokines is plotted in correlation to their ICOS cell surface expression density (A). Peak and mean ICOS fluorescence intensities of CD4+ T cells secreting a given cytokine are indicated. Note the different scale for TNF-α. The same data are plotted for all cytokines in a cumulative fashion in B.
Figure 3.
Figure 3.
Generation of OVA-specific CD4+ T cells with stable ICOS expression in vitro. (A) Prolonged ICOS expression on a subset of antigen-stimulated CD4+ T cells in vitro. CD8-depleted DO11.10 spleen cells were stimulated with OVA323–339, and aliquots stained daily for CD4, the OVA-TCR (mAb KJ1–26), and ICOS. The specificity of ICOS staining (black line) was established using a cold blocking control (gray line). Analysis gates were set on live CD4+OVA-TCR+ lymphocytes. Results shown are representative of four independent experiments. (B) Separation of OVA-specific, in vitro–activated CD4+ T cells into ICOS+ and ICOS populations. The cells stimulated as in panel A were on day 6 magnetically separated into ICOS+ and ICOS fractions and stained for CD4, CD69, and ICOS. Analysis gates were set on live CD4+ lymphocytes. The inserted numbers represent the percentages of CD4+ cells in each quadrant. (C) Stable ICOS expression on sorted ICOS+CD4+ T cells. Unseparated (squares), ICOS-depleted (triangles), and ICOS-enriched (circles) CD4+ OVA-specific T cells obtained on day 6 of culture with OVA323–339 were restimulated with PMA and ionomycin for 22 h, transferred into fresh medium, and further cultured for a total of 5 d. Immediately after separation into fractions, and then in daily intervals, aliquots of the cell populations were stained for CD4, CD69, and ICOS. In each case, the specificity of the ICOS staining was established using a cold blocking control. Analysis gates were set on live CD4+ lymphocytes. Percentages of ICOS+ and CD69+ cells in the CD4+ populations are indicated. Similar results were obtained in two independent experiments.
Figure 3.
Figure 3.
Generation of OVA-specific CD4+ T cells with stable ICOS expression in vitro. (A) Prolonged ICOS expression on a subset of antigen-stimulated CD4+ T cells in vitro. CD8-depleted DO11.10 spleen cells were stimulated with OVA323–339, and aliquots stained daily for CD4, the OVA-TCR (mAb KJ1–26), and ICOS. The specificity of ICOS staining (black line) was established using a cold blocking control (gray line). Analysis gates were set on live CD4+OVA-TCR+ lymphocytes. Results shown are representative of four independent experiments. (B) Separation of OVA-specific, in vitro–activated CD4+ T cells into ICOS+ and ICOS populations. The cells stimulated as in panel A were on day 6 magnetically separated into ICOS+ and ICOS fractions and stained for CD4, CD69, and ICOS. Analysis gates were set on live CD4+ lymphocytes. The inserted numbers represent the percentages of CD4+ cells in each quadrant. (C) Stable ICOS expression on sorted ICOS+CD4+ T cells. Unseparated (squares), ICOS-depleted (triangles), and ICOS-enriched (circles) CD4+ OVA-specific T cells obtained on day 6 of culture with OVA323–339 were restimulated with PMA and ionomycin for 22 h, transferred into fresh medium, and further cultured for a total of 5 d. Immediately after separation into fractions, and then in daily intervals, aliquots of the cell populations were stained for CD4, CD69, and ICOS. In each case, the specificity of the ICOS staining was established using a cold blocking control. Analysis gates were set on live CD4+ lymphocytes. Percentages of ICOS+ and CD69+ cells in the CD4+ populations are indicated. Similar results were obtained in two independent experiments.
Figure 4.
Figure 4.
In vitro–generated ICOS+ T cells have a similar Th2-biased, IL-10–dominated cytokine pattern as ICOS+ T cells ex vivo. (A) Unseparated, ICOS-depleted, and ICOS-enriched cells obtained on day 6 of culture with OVA323–339 were stimulated with PMA and ionomycin for 4.5 h in the presence of Brefeldin A for the last 2.5 h. After fixation, cells were stained for the OVA-TCR with mAb KJ1–26 and for various intracellular cytokines. Analysis gates were set on OVA-TCR+ lymphocytes. Percentages of cytokine-positive cells in the OVA-TCR+ population are indicated. Similar results were obtained in three independent experiments. (B) The same T cell populations were stimulated with PMA and ionomycin for 20 h. Cytokine concentrations in the supernatants were determined by ELISA. Similar results were obtained in three independent experiments.
Figure 4.
Figure 4.
In vitro–generated ICOS+ T cells have a similar Th2-biased, IL-10–dominated cytokine pattern as ICOS+ T cells ex vivo. (A) Unseparated, ICOS-depleted, and ICOS-enriched cells obtained on day 6 of culture with OVA323–339 were stimulated with PMA and ionomycin for 4.5 h in the presence of Brefeldin A for the last 2.5 h. After fixation, cells were stained for the OVA-TCR with mAb KJ1–26 and for various intracellular cytokines. Analysis gates were set on OVA-TCR+ lymphocytes. Percentages of cytokine-positive cells in the OVA-TCR+ population are indicated. Similar results were obtained in three independent experiments. (B) The same T cell populations were stimulated with PMA and ionomycin for 20 h. Cytokine concentrations in the supernatants were determined by ELISA. Similar results were obtained in three independent experiments.
Figure 5.
Figure 5.
Only the ICOS+ but not the ICOS CD4 T cells are inflammatory effectors. (A) Experimental design. CD8-depleted DO11.10 spleen cells were stimulated with OVA323–339. On day 6, the cells were separated into ICOS+ and ICOS fractions as shown in Fig. 3 B. Unseparated, ICOS-depleted, and ICOS-enriched fractions containing identical numbers of CD4+OVA-TCR+ T cells (1.5 × 10⁶/mouse) were transferred intravenously into BALB/c recipients exposed to an aerosol of OVA in PBS 24 h earlier. On days 1 and 2 after the transfer, the recipients were again exposed to OVA nebulization. On day 4, BAL was performed, and lung tissue, peribronchial and inguinal LN cells were removed and analyzed. (B) Stable ICOS expression in vivo. On day 4 after transfer, peribronchial LN cells from the three experimental groups were stained for ICOS, OVA-TCR, and CD3. Analysis gates were set on CD3+ T cells. The inserted numbers represent the percentages of CD3+ cells in each quadrant. Note that the vast majority of transgenic T cells in the ICOS-enriched recipients express ICOS, albeit to varying degree. (C) Accumulation of inflammatory effector cells in the airway lumen is strictly dependent on the presence of ICOS+ T cells. On day 4 after cell transfer, the total number and frequency of lymphocytes, macrophages, neutrophils, and eosinophils in the BAL fluid were determined. The mice of the control group had been transferred with unseparated CD4+OVA-TCR+ T cells but had been exposed to PBS instead of OVA aerosol. Data are shown as the mean ± SEM of 6–8 animals. Similar results were obtained in two independent experiments. (D) Peribronchial infiltration of inflammatory effector cells in the lung is highly dependent on the presence of ICOS+ T cells. Lung sections of animals transferred with ICOS+ and ICOS cell fractions were stained for T cells (CD3), B cells (CD45R/B220), macrophages (F4/80), neutrophils (Ly-6G), and eosinophils (major basic protein, MBP), and analyzed by conventional and confocal laser microscopy (original magnification 20×, bar scale indicates 50 μm; AS, alveolar space; BL, bronchial lumen; EP, epithelium).
Figure 5.
Figure 5.
Only the ICOS+ but not the ICOS CD4 T cells are inflammatory effectors. (A) Experimental design. CD8-depleted DO11.10 spleen cells were stimulated with OVA323–339. On day 6, the cells were separated into ICOS+ and ICOS fractions as shown in Fig. 3 B. Unseparated, ICOS-depleted, and ICOS-enriched fractions containing identical numbers of CD4+OVA-TCR+ T cells (1.5 × 10⁶/mouse) were transferred intravenously into BALB/c recipients exposed to an aerosol of OVA in PBS 24 h earlier. On days 1 and 2 after the transfer, the recipients were again exposed to OVA nebulization. On day 4, BAL was performed, and lung tissue, peribronchial and inguinal LN cells were removed and analyzed. (B) Stable ICOS expression in vivo. On day 4 after transfer, peribronchial LN cells from the three experimental groups were stained for ICOS, OVA-TCR, and CD3. Analysis gates were set on CD3+ T cells. The inserted numbers represent the percentages of CD3+ cells in each quadrant. Note that the vast majority of transgenic T cells in the ICOS-enriched recipients express ICOS, albeit to varying degree. (C) Accumulation of inflammatory effector cells in the airway lumen is strictly dependent on the presence of ICOS+ T cells. On day 4 after cell transfer, the total number and frequency of lymphocytes, macrophages, neutrophils, and eosinophils in the BAL fluid were determined. The mice of the control group had been transferred with unseparated CD4+OVA-TCR+ T cells but had been exposed to PBS instead of OVA aerosol. Data are shown as the mean ± SEM of 6–8 animals. Similar results were obtained in two independent experiments. (D) Peribronchial infiltration of inflammatory effector cells in the lung is highly dependent on the presence of ICOS+ T cells. Lung sections of animals transferred with ICOS+ and ICOS cell fractions were stained for T cells (CD3), B cells (CD45R/B220), macrophages (F4/80), neutrophils (Ly-6G), and eosinophils (major basic protein, MBP), and analyzed by conventional and confocal laser microscopy (original magnification 20×, bar scale indicates 50 μm; AS, alveolar space; BL, bronchial lumen; EP, epithelium).

References

    1. Hutloff, A., A.M. Dittrich, K.C. Beier, B. Eljaschewitsch, R. Kraft, I. Anagnostopoulos, and R.A. Kroczek. 1999. ICOS is an inducible T-cell co-stimulator structurally and functionally related to CD28. Nature. 397:263–266. - PubMed
    1. Yoshinaga, S.K., J.S. Whoriskey, S.D. Khare, U. Sarmiento, J. Guo, T. Horan, G. Shih, M. Zhang, M.A. Coccia, T. Kohno, et al. 1999. T-cell co-stimulation through B7RP-1 and ICOS. Nature. 402:827–832. - PubMed
    1. Coyle, A.J., S. Lehar, C. Lloyd, J. Tian, T. Delaney, S. Manning, T. Nguyen, T. Burwell, H. Schneider, J.A. Gonzalo, et al. 2000. The CD28-related molecule ICOS is required for effective T cell-dependent immune responses. Immunity. 13:95–105. - PubMed
    1. McAdam, A.J., T.T. Chang, A.E. Lumelsky, E.A. Greenfield, V.A. Boussiotis, J.S. Duke-Cohan, T. Chernova, N. Malenkovich, C. Jabs, V.K. Kuchroo, et al. 2000. Mouse inducible costimulatory molecule (ICOS) expression is enhanced by CD28 costimulation and regulates differentiation of CD4+ T cells. J. Immunol. 165:5035–5040. - PubMed
    1. Özkaynak, E., W. Gao, N. Shemmeri, C. Wang, J.C. Gutierrez-Ramos, J. Amaral, S. Qin, J.B. Rottman, A.J. Coyle, and W.W. Hancock. 2001. Importance of ICOS-B7RP-1 costimulation in acute and chronic allograft rejection. Nat. Immunol. 2:591–596. - PubMed

Publication types

MeSH terms