. 2003 Jan 20;197(2):221-32.
doi: 10.1084/jem.20021408.

Host prostaglandin E(2)-EP3 signaling regulates tumor-associated angiogenesis and tumor growth

Affiliations

Host prostaglandin E(2)-EP3 signaling regulates tumor-associated angiogenesis and tumor growth

Hideki Amano et al. J Exp Med. .

Abstract

Nonsteroidal antiinflammatories are known to suppress incidence and progression of malignancies including colorectal cancers. However, the precise mechanism of this action remains unknown. Using prostaglandin (PG) receptor knockout mice, we have evaluated a role of PGs in tumor-associated angiogenesis and tumor growth, and identified PG receptors involved. Sarcoma-180 cells implanted in wild-type (WT) mice formed a tumor with extensive angiogenesis, which was greatly suppressed by specific inhibitors for cyclooxygenase (COX)-2 but not for COX-1. Angiogenesis in sponge implantation model, which can mimic tumor-stromal angiogenesis, was markedly suppressed in mice lacking EP3 (EP3(-/-)) with reduced expression of vascular endothelial growth factor (VEGF) around the sponge implants. Further, implanted tumor growth (sarcoma-180, Lewis lung carcinoma) was markedly suppressed in EP3(-/-), in which tumor-associated angiogenesis was also reduced. Immunohistochemical analysis revealed that major VEGF-expressing cells in the stroma were CD3/Mac-1 double-negative fibroblasts, and that VEGF-expression in the stroma was markedly reduced in EP3(-/-), compared with WT. Application of an EP3 receptor antagonist inhibited tumor growth and angiogenesis in WT, but not in EP3(-/-). These results demonstrate significance of host stromal PGE(2)-EP3 receptor signaling in tumor development and angiogenesis. An EP3 receptor antagonist may be a candidate of chemopreventive agents effective for malignant tumors.


Figures
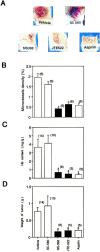
Figure 1.
Figure 1.
Effects of COX inhibitors on tumor growth and angiogenesis. (A) Typical appearance of tumors. A suspension of sarcoma 180 cells, which are allogeneic for ddy mice, was injected into subcutaneous tissue of ddy mice. COX inhibitors (SC-560, NS-398, and JTE-522, 3 mg/ml; aspirin, 10 mg/ml) were administered orally as a suspension (0.1 ml per 10 g of body mass) twice a day (every 12 h) beginning on the day of cell implantation and continuing throughout the 14-d experimental period. Tumors were then dissected and photographed. (B and C) The density of microvessels and hemoglobin content of tumor tissue were determined at the end of the 14-d experimental period. Data are means ± SEM for the indicated number of tumors. *P < 0.05 versus vehicle-treated mice (ANOVA). (D) The mass of tumor tissue was determined at the end of the 14-d experimental period. All experiments were performed using male ddy mice. Data are means ± SEM for the indicated number of tumors. *P < 0.05 versus vehicle-treated mice (ANOVA).
Figure 2.
Figure 2.
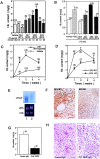
Angiogenesis in sponge-induced granulation tissues. (A) Hemoglobin content for male ddy mice treated with agonists selective for each EP subtype. ONO-DI-004 (EP1 agonist), ONO-AEI-257 (EP2 agonist), ONO-AE-248 (EP3 agonist), or ONO-AEI-329 (EP4 agonist) was topically injected into the implanted sponge over a period of 14 d (10 or 30 nmol per sponge per day) beginning on the day of implantation. Sponge-induced granulation tissue was dissected and its hemoglobin content was determined. Data are means ± SEM for the indicated number of sponges (shown in parentheses). *P < 0.05 versus vehicle-injected sponges (ANOVA). (B) Hemoglobin content for COX-2 inhibitor-treated ddy mice receiving topical injections of EP subtype agonist. Each agonist was topically injected into the sponge over a period of 14 d (30 nmol per sponge per day). Sponge-induced granulation tissue was dissected and its hemoglobin content was determined. Data are means ± SEM for the indicated number of sponges (shown in parentheses). *P < 0.05 versus vehicle-injected sponges (ANOVA). (C) Time courses of hemoglobin content during topical injections of an EP3 agonist, ONO-AE-248 (30 nmol per sponge per day). Data are means ± SEM for the indicated number of sponges implanted in subcutaneous tissues. *P < 0.05 versus corresponding value for vehicle-injected sponges (ANOVA). (D) Time courses of sponge angiogenesis in EP3+/+ (WT) and EP3−/− (KO) mice. Data are means ± SEM for the indicated number of sponges. *P < 0.05 versus corresponding value for WT mice (ANOVA). (E) Northern blot analysis of VEGF mRNA. Sponge granulation tissue was isolated 14 d after the implantation in EP3+/+ mice (lanes 1) and EP3−/− mice (lanes 2). Total RNA was prepared and subjected to Northern blot analysis of VEGF mRNA (top panel). The bottom panel also shows ethidium bromide staining of 28S and 18S mRNA. (F) Immunohistochemical localization of VEGF in sponge-induced granulation tissues. Sections of granulation tissue isolated from EP3+/+ (EP3 WT) and EP3−/− (EP3 KO) mice 14 d after sponge implantation were stained with antibodies to VEGF. Scale bar, 50 μm. (G) Effects of topical injections with antibodies to VEGF on angiogenesis. Sponges were implanted to in C57BL/6 WT mice treated with the EP3 agonist (30 nmol per site per day) for 14 d. Sponges were also injected with either IgG specific for mouse VEGF (10 μg per sponge per day) or nonimmune control IgG. Data are means ± SEM for the indicated number of sponges. *P < 0.05 versus sponges injected with control IgG (Student's t test). (H) Effects of topical injections with antibodies to VEGF on angiogenesis. Hematoxylin-eosin staining of sections prepared from granulation tissues in C57BL/6 WT mice. The arrows indicate neovasculized vessels. Scale bar, 50 μm. The experiments were performed in male ddy mice (A–C), male EP3−/− and WT C57BL/6 mice (D–F), and male WT C57BL/6 mice (G and H).
Figure 3.
Figure 3.
Tumor growth and angiogenesis in prostanoid receptor knockout mice. Sarcoma 180 cells, which are allogeneic for C57BL/6 mice, were injected to the subcutaneous tissue of the back except the experiment shown in panel F. (A and C) Tumor-associated angiogenesis was determined by the density of microvessels and hemoglobin content 7 and 14 d after injection of sarcoma 180 cells. (B) Tumor weight was also measured. Data are means ± SEM for the indicated number of tumors. *P < 0.05 versus corresponding value for WT mice (ANOVA). *P < 0.05, EP3 KO versus EP2 KO (Dunnett comparison). (D) Appearance of tumors. Tumors formed 14 d after injection of sarcoma 180 cells into (WT) and EP3−/− (KO) mice were dissected and photographed. (E) Hematoxylin-eosin staining of tumors from (WT) and EP3−/− (KO) mice. Scale bar, 100 μm. (F) Tumor mass assessed 21 and 28 d after injection of another tumor cell line, Lewis Lung carcinoma cells suspension (5 × 10⁷ cells/ml, 100 μl/site) into the subcutaneous tissue of male mice. This cell line was syngeneic for C57BL/6 mice. The tumor volume was determined, as described before (reference 6). Data are means ± SEM for the indicated number of tumors. *P < 0.05 versus WT animals (Student's t test). All experiments were performed using male C57BL/6 mice with and without disruption of EP receptor subtypes or IP receptor.
Figure 4.
Figure 4.
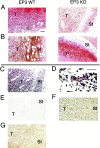
Expression of COX-2, VEGF, EP3 receptor in tumors and surrounding stroma tissues in WT mice and EP3 knockout mice 14 d after implantation of sarcoma 180 cells. (A) Immunohistochemical analysis of COX-2 expression in tumor (T) and stromal (St) tissue in WT EP3+/+ (EP3 WT, left) and EP3−/− (EP3 KO, right) mice. COX-2 was apparent in both tumor cells and surrounding stromal cells, with no marked differences in the number of positive cells apparent between EP3−/− mice and their WT counterparts. Scale bar, 100 μm. (B) Immunohistochemical analysis of VEGF expression in tumor and stromal tissue in WT (left) and EP3−/− (right) mice. VEGF-positive cells were apparent in the marginal zone of the tumor and in the surrounding stromal cells. Staining was more intense in wild-type mice than in EP3−/− mice. (C–E) In situ hybridization analysis of EP3 mRNA in tumor and stromal tissue from WT mice. D, stromal tissue (high magnitude, scale bar 10 μm, arrowhead; neovascularization); E, results from control sense probe. (F) Immunohistochemical analysis of CD3e expression in tumor and stromal tissue in WT mice. (G) Immunohistochemical analysis of Mac-1 expression in tumor and stromal tissue in WT mice. All experiments were performed using male C57BL/6 mice with and without disruption of EP3 receptor. Sarcoma 180 cells, which are allogeneic for C57BL/6 mice, were injected to the subcutaneous tissues.
Figure 5.
Figure 5.
Expression of VEGF, EP receptor subtypes, and CD31 in tumors and surrounding stroma tissues in C57BL6 WT mice and EP3 knockout mice, and effects of a VEGF neutralizing antibody and a VEGF receptor kinase inhibitor on tumor growth and tumor-associated angiogenesis. Sarcoma 180 cells, which are allogeneic for C57BL/6 mice, were injected to the subcutaneous tissues. (A) RT-PCR analysis of EP1, EP2, EP3, EP4, VEGF, and CD31 mRNAs in tumor tissue dissected together with surrounding stroma (T + St), as well as in control subcutaneous tissue (H) dissected from sites distant from tumors, of WT and EP3−/− mice. 14 d after implantation, sample tissues were isolated. (B) A ratio of desmin mRNA/CD31 mRNA. Real time RT-PCR analysis was performed as described in the methods, and a ratio of the expression of desmin mRNA to that of CD31 mRNA was determined. Data are means ± SEM for 4 samples prepared as above. *P < 0.05 compared with H, and #P < 0.05 compared with T+ST in EP3WT (ANOVA). (C) Gel shift assay. Primary cultured fibroblasts from WT and EP3−/− mice were stimulated with ONO-AE-248, a EP3 agonist. Activation of AP-1 was determined by EMSA. Lanes 1, 2, and 7, or 3 to 6, without or with ONO-AE-248; lanes 4 and 6, presence of unlabeled oligonucleotide with nuclear extract, by which specificity was evaluated by oligonucleotide competition and EMSA; lane 7, control oligonucleotide without nuclear extract. (D and E) Effects of an anti-VEGF antibody and a VEGF receptor kinase inhibitor on tumor growth and angiogenesis in WT and EP3−/− mice. Tumor-associated angiogenesis was determined 14 d after injection of sarcoma 180 cells. Either IgG specific for mouse VEGF (10 μg per tumor per day, once a day) or nonimmune control IgG was topically injected around the tumors (D). Either VEGF receptor kinase inhibitor, ZD6474 (100 mg/kg, once a day) or vehicle control solution was orally administered (E). Data are means ± SEM for the indicated number of tumors. *P < 0.05 compared with WT mice receiving control IgG or vehicle solution (ANOVA).
Figure 6.
Figure 6.
Effect of an EP3 antagonist on tumor growth and tumor-associated angiogenesis. Sarcoma 180 cells, which are allogeneic for C57BL/6 mice, were injected to the subcutaneous tissues. (A) Tumor-associated angiogenesis was determined in WT mice by the density of microvessels 14 d after the injection. Tumor weight was also determined 14 d after the injection. An EP1 antagonist (EP1 antago, ONO-8711), an EP3 antagonist (EP3 antago, ONO-AE3–240), or an EP4 antagonist (EP4 antago, ONO-AE3–208) was topically injected around the tumors (twice a day, 50 nmole per tumor). EP3 antago (1) and (2); twice a day, 50 and 15 nmole per tumor, respectively. Data are means ± SEM for the indicated number of tumors. *P < 0.05 versus corresponding value for WT mice injected with vehicle solution (ANOVA). (B) Tumor growth and tumor-associated angiogenesis were determined in EP3−/− (KO) mice 14 d after injection of sarcoma 180 cells. An EP3 antagonist (ONO-AE3–240) was topically injected around the tumors. EP3 antago (1) and (2); 50 and 15 nmole per tumor per day, respectively. Data are means ± SEM for the indicated number of tumors. *P < 0.05 versus corresponding value for EP3 KO mice injected with vehicle solution (ANOVA). (C) Schematic drawing of the major signaling pathway of PGE2 generated through the action of COX-2. Host stromal PGE2-EP3 signaling appears critical for tumor-associated angiogenesis and tumor growth. EP3 signaling on the stromal cells is relevant to the induction of a potent proangiogenic growth factor, VEGF in stromal cells. Up-regulated VEGF certainly has a proangiogenic action, and facilitates tumor growth. A highly selective EP3 antagonist such as ONO-AE3–240 therefore exhibits chemoprevetive action, and will become a novel tools for cancer prevention. All experiments were performed using male C57BL/6 mice with and without disruption of EP3 receptor.

References

    1. Smalley, W., and R.N. Dubois. 1997. Colorectal cancer and non steroidal anti-inflammatory drugs. Adv. Pharmacol. 39:1–20. - PubMed
    1. Ohshima, M., J.E. Dinchuk, S.L. Kargman, H. Oshima, B. Hancock, E. Kwong, J.M. Trzaskos, J.F. Evans, and M.M. Taketo. 1996. Suppression of intestinal polyposis in Apc Δ716 knockout mice by inhibition of cyclooxygenase 2 (COX-2). Cell. 87:803–809. - PubMed
    1. Marx, J. 2001. Cancer research. Anti-inflammatories inhibit cancer growth–but how? Science. 291:581–582. - PubMed
    1. Prescott, S.M., and R.L. White. 1996. Self-promotion? Intimate connections between APC and prostaglandin H synthase-2. Cell. 87:783–786. - PubMed
    1. Shiff, S.J., and B. Rigas. 1997. Nonsteroidal anti-inflammatory drugs and colorectal cancer: evolving concepts of their chemopreventive actions. Gastroenterology. 113:1992–1998. - PubMed

Publication types

MeSH terms