. 2003 Feb 4;100(3):1262-7.
doi: 10.1073/pnas.0336398100. Epub 2003 Jan 21.

Deficiency of acyl CoA:cholesterol acyltransferase 2 prevents atherosclerosis in apolipoprotein E-deficient mice

Affiliations

Deficiency of acyl CoA:cholesterol acyltransferase 2 prevents atherosclerosis in apolipoprotein E-deficient mice

Emily L Willner et al. Proc Natl Acad Sci U S A. .

Abstract

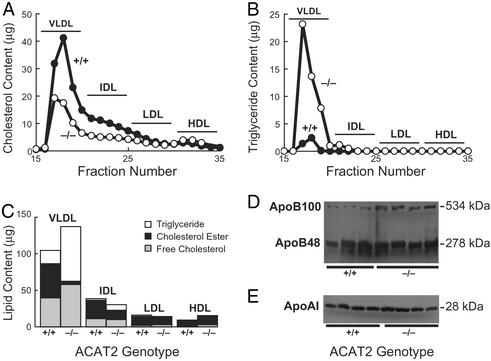
Deficiency of acyl CoA:cholesterol acyltransferase 2 (ACAT2) in mice results in a reduction in cholesterol ester synthesis in the small intestine and liver, which in turn limits intestinal cholesterol absorption, hepatic cholesterol gallstone formation, and the accumulation of cholesterol esters in the plasma lipoproteins. Here we examined the contribution of ACAT2-derived cholesterol esters to atherosclerosis by crossing ACAT2-deficient (ACAT2(-/-)) mice with apolipoprotein (apo) E-deficient (ApoE(-/-)) mice, an atherosclerosis-susceptible strain that has impaired apoE-mediated clearance of apoB-containing lipoproteins. ACAT2(-/-) ApoE(-/-) mice and ACAT2(+/+) ApoE(-/-) (control) mice had similar elevations of plasma apoB and total plasma lipids; however, the lipid cores of the apoB-containing lipoproteins in ACAT2(-/-) ApoE(-/-) mice contained primarily triglycerides rather than cholesterol esters. At 30 wk of age, only the control mice had significant atherosclerosis, which was nearly absent in ACAT2(-/-) ApoE(-/-) mice. ACAT2 deficiency in the apoE-deficient background also led to a compensatory increase in the activity of lecithincholesterol acyltransferase, the major plasma cholesterol esterification enzyme, which increased high-density lipoprotein cholesterol esters. Our results demonstrate the crucial role of ACAT2-derived cholesterol esters in the development of atherosclerosis in mice and suggest that triglyceride-rich apoB-containing lipoproteins are not as atherogenic as those containing cholesterol esters. Our results also support the rationale of pharmacological inhibition of ACAT2 as a therapy for atherosclerosis.


Figures

Figure 1
Figure 1
Plasma lipoproteins and apolipoproteins in chow-fed ACAT2+/+ ApoE–/– and ACAT2–/– ApoE–/– mice. Total cholesterol levels (A) and triglyceride levels (B) in plasma fractions isolated by FPLC are shown. Plasma samples from three 24- to 26-week-old female mice of each genotype were pooled for analysis. The experiment was repeated twice, and similar results were obtained, although some variability in triglyceride content was observed. (C) Plasma lipid composition in lipoproteins from female mice. Plasma samples from three mice of each genotype were pooled, and lipoproteins were separated by FPLC. Lipid contents in fractions were summed to determine the content of each of the major lipoprotein classes (VLDL, fractions 17–20; intermediate-density lipoproteins, fractions 21–25; LDL, fractions 26–30; HDL, fractions 31–35). Cholesterol ester values reflect the esterified cholesterol mass in the sample. (D) Plasma apoB levels. Plasma samples (0.5 μl) were subjected to SDS/PAGE and immunoblotting for apoB. Data are shown for three ACAT2+/+ ApoE–/– mice and four ACAT2–/– ApoE–/– mice. (E) Plasma apoAI levels. Plasma samples (1 μl) were subjected to SDS/PAGE and immunoblotting for apoAI. Data are shown for four mice of each genotype.
Figure 2
Figure 2
Prevention of atherosclerosis in ACAT2–/– ApoE–/– mice. (A) Lesion areas as a percentage of total aortic surface in ACAT2+/+ ApoE–/– (n = 13) and ACAT2–/– ApoE–/– (n = 17) mice after 27 weeks of chow feeding. The horizontal bar indicates the mean. *, P < 0.001. (B) Lesion areas in the proximal (arch), middle (thorax), and distal (abdomen) thirds of aortas. *, P < 0.01. (C) Regression analysis of total aortic lesion areas and plasma lipid levels. Data are plotted for those mice in which both lipid levels and atherosclerosis levels were measured. Regression lines represent data from both genotypes.
Figure 3
Figure 3
Representative images showing the extent of aortic atherosclerosis in chow-fed ACAT2+/+ ApoE–/– and ACAT2–/– ApoE–/– mice. (A) Pinned-out aortas showing surface lesions (arrows) in ACAT2+/+ ApoE–/– but not in ACAT2–/– ApoE–/– mice. (B) Cross sections of proximal aortic roots showing Oil-red-O-staining lesions (arrow points to example) in ACAT2+/+ ApoE–/– but not in ACAT2–/– ApoE–/– mice. (Bar = 500 μm.)
Figure 4
Figure 4
Analysis of determinants of HDL metabolism in ACAT2+/+ ApoE–/– and ACAT2–/– ApoE–/– mice. (A) Similar levels of SR-BI protein in livers from ACAT2+/+ ApoE–/– and ACAT2–/– ApoE–/– mice. Homogenized liver samples (125 μg of total protein) were subjected to SDS/PAGE and immunoblotting for SR-BI. Membranes were stripped and immunoblotting for the LDL receptor-related protein (LRP) was performed as a control for protein content. Data for four mice of each genotype are shown. (B) Increased LCAT activity in ACAT2–/– ApoE–/– mice. LCAT activity was determined in plasma samples from six mice of each genotype. *, P = 0.02. (C) Altered composition of plasma cholesterol esters in ACAT2–/– ApoE–/– mice. Cholesterol esters were isolated by TLC from plasma samples from six mice of each genotype. The fatty acid content of the cholesterol esters was analyzed by gas chromatography. Data for each fatty acid are expressed as a percentage (wt/wt) of the total cholesterol esters. *, P < 0.05.

References

    1. Chang T Y, Chang C C Y, Cheng D. Annu Rev Biochem. 1997;66:613–638. - PubMed
    1. Buhman K F, Accad M, Farese R V., Jr Biochim Biophys Acta. 2000;1529:142–154. - PubMed
    1. Rudel L L, Lee R G, Cockman T L. Curr Opin Lipidol. 2001;12:121–127. - PubMed
    1. Chang C C Y, Huh H Y, Cadigan K M, Chang T Y. J Biol Chem. 1993;268:20747–20755. - PubMed
    1. Uelmen P J, Oka K, Sullivan M, Chang C C Y, Chang T Y, Chan L. J Biol Chem. 1995;270:26192–26201. - PubMed

Publication types

MeSH terms

LinkOut - more resources