

Time series modeling for syndromic surveillance
- PMID: 12542838
- PMCID: PMC149370
- DOI: 10.1186/1472-6947-3-2
Time series modeling for syndromic surveillance
Abstract
Background: Emergency department (ED) based syndromic surveillance systems identify abnormally high visit rates that may be an early signal of a bioterrorist attack. For example, an anthrax outbreak might first be detectable as an unusual increase in the number of patients reporting to the ED with respiratory symptoms. Reliably identifying these abnormal visit patterns requires a good understanding of the normal patterns of healthcare usage. Unfortunately, systematic methods for determining the expected number of (ED) visits on a particular day have not yet been well established. We present here a generalized methodology for developing models of expected ED visit rates.
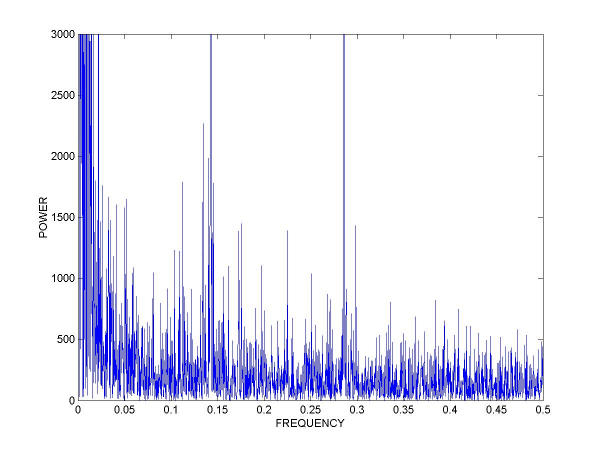
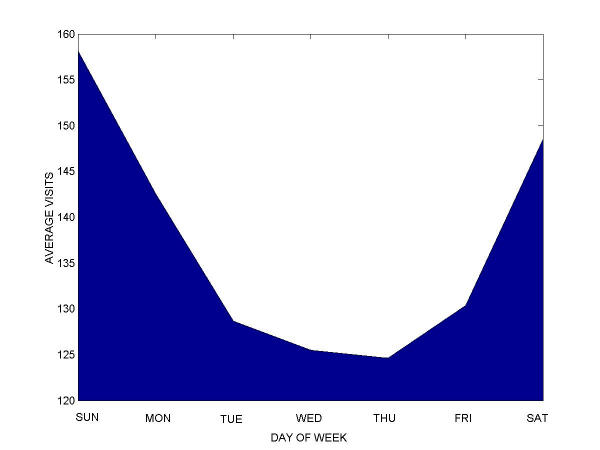
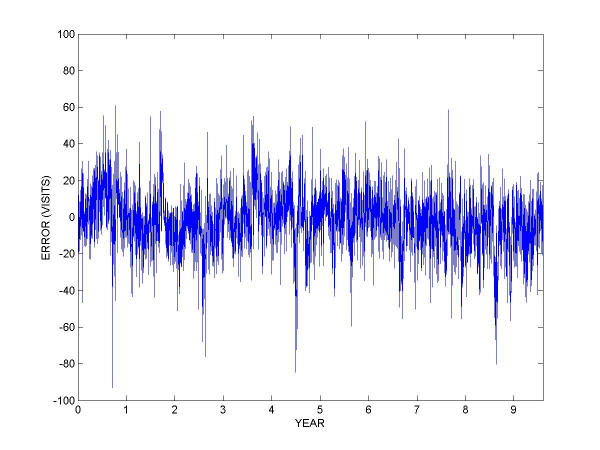
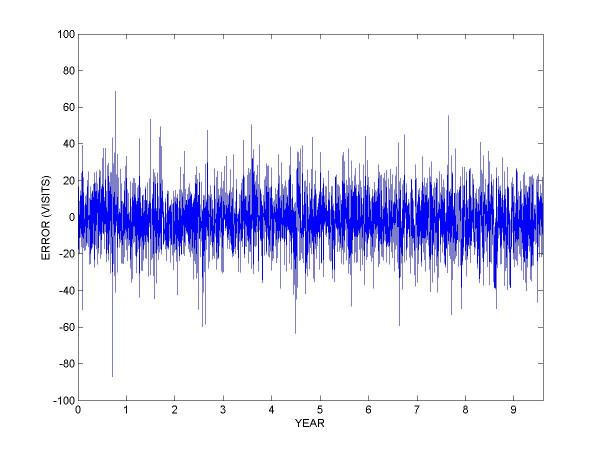
Methods: Using time-series methods, we developed robust models of ED utilization for the purpose of defining expected visit rates. The models were based on nearly a decade of historical data at a major metropolitan academic, tertiary care pediatric emergency department. The historical data were fit using trimmed-mean seasonal models, and additional models were fit with autoregressive integrated moving average (ARIMA) residuals to account for recent trends in the data. The detection capabilities of the model were tested with simulated outbreaks.
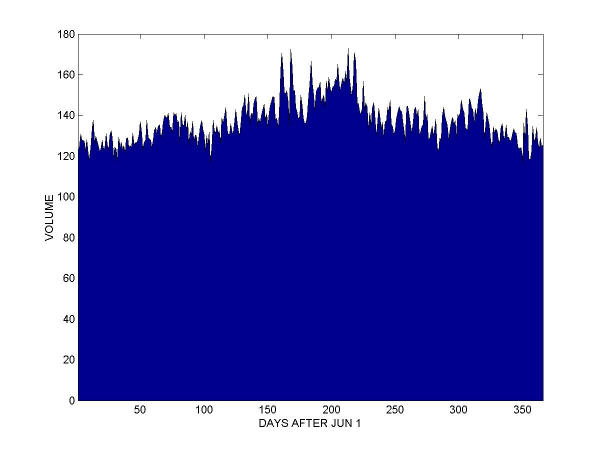
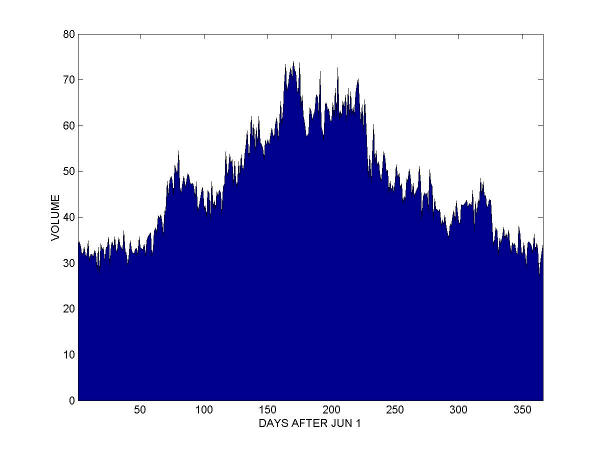
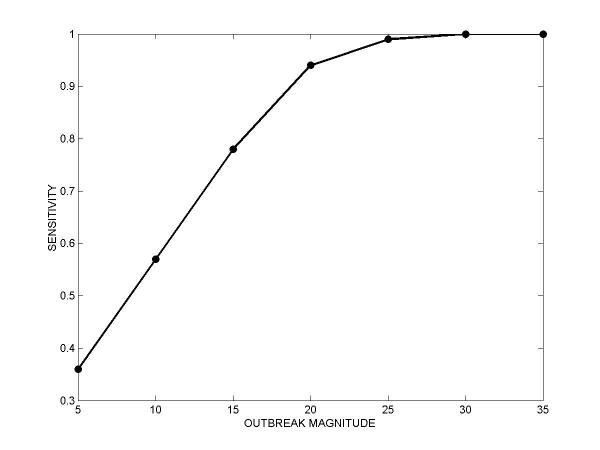
Results: Models were built both for overall visits and for respiratory-related visits, classified according to the chief complaint recorded at the beginning of each visit. The mean absolute percentage error of the ARIMA models was 9.37% for overall visits and 27.54% for respiratory visits. A simple detection system based on the ARIMA model of overall visits was able to detect 7-day-long simulated outbreaks of 30 visits per day with 100% sensitivity and 97% specificity. Sensitivity decreased with outbreak size, dropping to 94% for outbreaks of 20 visits per day, and 57% for 10 visits per day, all while maintaining a 97% benchmark specificity.
Conclusions: Time series methods applied to historical ED utilization data are an important tool for syndromic surveillance. Accurate forecasting of emergency department total utilization as well as the rates of particular syndromes is possible. The multiple models in the system account for both long-term and recent trends, and an integrated alarms strategy combining these two perspectives may provide a more complete picture to public health authorities. The systematic methodology described here can be generalized to other healthcare settings to develop automated surveillance systems capable of detecting anomalies in disease patterns and healthcare utilization.
Figures
References
-
- From the Centers for Disease Control and Prevention Considerations for distinguishing influenza-like illness from inhalational anthrax. JAMA. 2001;286:2537–9. - PubMed
-
- Batal H, et al. Predicting patient visits to an urgent care clinic using calendar variables. Acad Emerg Med. 2001;8:48–53. - PubMed
-
- Bowdish GE, et al. Using regression analysis to predict emergency patient volume at the Indianapolis 500 mile race. Ann Emerg Med. 1992;21:1200–3. - PubMed
-
- Green MS, Kaufman Z. Surveillance for early detection and monitoring of infectious disease outbreaks associated with bioterrorism. Isr Med Assoc J. 2002;4:503–6. - PubMed
Publication types
MeSH terms
Grants and funding
LinkOut - more resources
Full Text Sources
Medical
