

Population pharmacokinetic analysis of nonlinear behavior of piperacillin during intermittent or continuous infusion in patients with cystic fibrosis
- PMID: 12543656
- PMCID: PMC151777
- DOI: 10.1128/AAC.47.2.541-547.2003
Population pharmacokinetic analysis of nonlinear behavior of piperacillin during intermittent or continuous infusion in patients with cystic fibrosis
Abstract
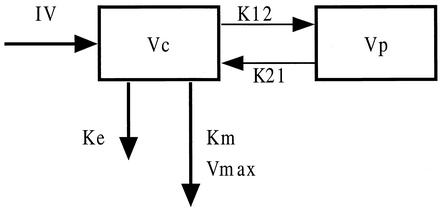
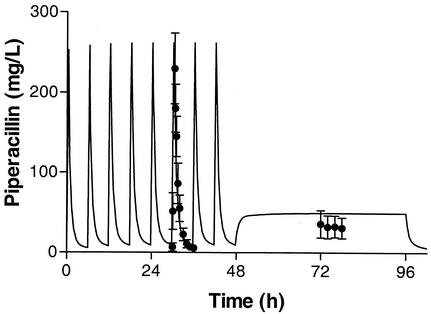
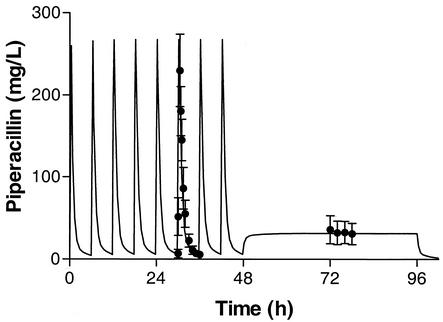
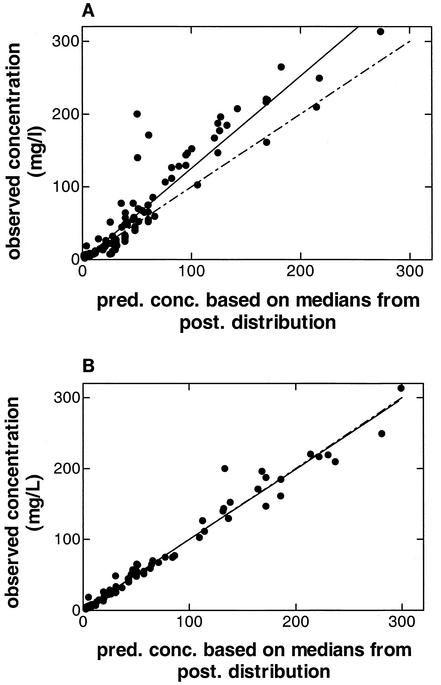
The purpose of this study was to describe the nonlinear pharmacokinetics of piperacillin observed during intermittent infusion and continuous infusion by using a nonparametric population modeling approach. Data were 120 serum piperacillin concentration measurements from eight adult cystic fibrosis (CF) patients. Individual pharmacokinetic parameter estimates during intermittent infusion or continuous infusion were calculated by noncompartmental analysis and with a maximum iterative two-stage Bayesian estimator. To simultaneously describe concentration-time data during intermittent infusion and continuous infusion, nonlinear models were parameterized as two-compartment Michaelis-Menten models. Models were fit to the data with the nonparametric expectation maximization algorithm. The calculations were executed on a remote supercomputer. Nonlinear models were evaluated by log-likelihood estimates, residual plots, and R(2) values, and predictive performance was based on bias (mean weighted error [MWE]) and precision (mean weighted square error [MWSE]). A linear pharmacokinetic model could not describe combined intermittent infusion and continuous infusion data well. A good population model fit to the intermittent infusion and continuous infusion data was obtained with the constructed nonlinear models. Maximum a posteriori probability (MAP) Bayesian R(2) values for the nonlinear models were 0.96 to 0.97. Median parameter estimates for the best nonlinear model were as follows: K(m), 58 +/- 75 mg/liter (mean and standard deviation); V(max), 1,904 +/- 1,009 mg/h; volume of distribution of the central compartment, 14.1 +/- 3.0 liters; k(12), 0.63 +/- 0.41 h(-1); and k(21), 0.37 +/- 0.19 h(-1). The median bias (MWE) and precision (MWSE) values for MAP Bayesian estimation with the Michaelis-Menten model were 0.05 and 4.6 mg/liters, respectively. The developed nonlinear pharmacokinetic models can be used to optimize piperacillin therapy administered via continuous infusion in patients with CF and have distinct advantages over conventional linear models.
Figures
References
-
- Batra, V. K., J. A. Morrison, K. C. Lasseter, and V. A. Joy. 1979. Piperacillin kinetics. Clin. Pharmacol. Ther. 26:41-53. - PubMed
-
- Bergan, T., and J. D. Williams. 1982. Dose dependence of piperacillin pharmacokinetics. Chemotherapy 28:153-159. - PubMed
-
- Bryson, H. M., and R. N. Brogden. 1994. Piperacillin/tazobactam. A review of its antibacterial activity, pharmacokinetic properties and therapeutic potential. Drugs 47:506-535. - PubMed
Publication types
MeSH terms
Substances
Grants and funding
LinkOut - more resources
Full Text Sources
Medical
