

Medical expenditures during the last year of life: findings from the 1992-1996 Medicare current beneficiary survey
- PMID: 12546289
- PMCID: PMC1464043
- DOI: 10.1111/1475-6773.01113
Medical expenditures during the last year of life: findings from the 1992-1996 Medicare current beneficiary survey
Abstract
Objective: To compare medical expenditures for the elderly (65 years old) over the last year of life with those for nonterminal years.
Data source: From the 1992-1996 Medicare Current Beneficiary Survey (MCBS) data from about ten thousand elderly persons each year.
Study design: Medical expenditures for the last year of life and nonterminal years by source of payment and type of care were estimated using robust covariance linear model approaches applied to MCBS data.
Data collection: The MCBS is a panel survey of a complex weighted multilevel random sample of Medicare beneficiaries. A structured questionnaire is administered at four-month intervals to collect all medical costs by payer and service. Medicare costs are validated by claims records.
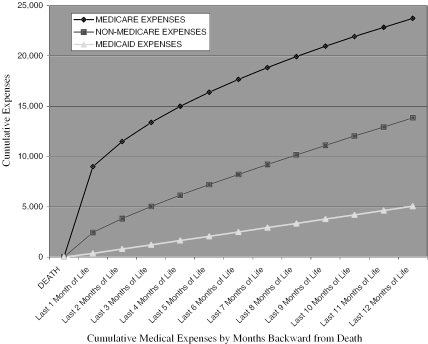
Principal findings: From 1992 to 1996, mean annual medical expenditures (1996 dollars) for persons aged 65 and older were $37,581 during the last year of life versus $7,365 for nonterminal years. Mean total last-year-of-life expenditures did not differ greatly by age at death. However, non-Medicare last-year-of-life expenditures were higher and Medicare last-year-of-life expenditures were lower for those dying at older ages. Last-year-of-life expenses constituted 22 percent of all medical, 26 percent of Medicare, 18 percent of all non-Medicare expenditures, and 25 percent of Medicaid expenditures.
Conclusions: While health services delivered near the end of life will continue to consume large portions of medical dollars, the portion paid by non-Medicare sources will likely rise as the population ages. Policies promoting improved allocation of resources for end-of-life care may not affect non-Medicare expenditures, which disproportionately support chronic and custodial care.
Figures
References
-
- Barnato AE, Garber AM, Kagay CR, McClellan MC. “Trends in the Use of Intensive Procedures at the End of Life.”. In: Garber A, editor. Frontiers in Health Policy Research. Vol. 2. Cambridge, MA: MIT Press; 1999.
-
- Callahan D. Setting Limits Medical Goals in an Aging Society. New York: Simon and Schuster; 1987. - PubMed
-
- Crystal S, Harman J, Sambamoorthi U, Johnson R, Kumar R. “Out of Pocket Health Care Costs among Older Americans.”. Journal of Gerontology: Social Sciences. 2000;55B(1):S51–S62. - PubMed
-
- Cutler DM, McClellan MC. “Is Technical Change Worth It?”. Health Affairs. 2001;20(5):11–29. - PubMed
-
- Emanuel EJ. “Cost Savings at the End of Life. What Do the Data Show? [see comments]”. Journal of the American Medical Association. 1996;275(24):1907–14. - PubMed
Publication types
MeSH terms
Grants and funding
LinkOut - more resources
Full Text Sources
Medical
