. 2003 Jan 23;37(2):287-97.
doi: 10.1016/s0896-6273(03)00025-4.

Extracellular Ca2+ depletion contributes to fast activity-dependent modulation of synaptic transmission in the brain

Affiliations

Extracellular Ca2+ depletion contributes to fast activity-dependent modulation of synaptic transmission in the brain

D A Rusakov et al. Neuron. .

Abstract

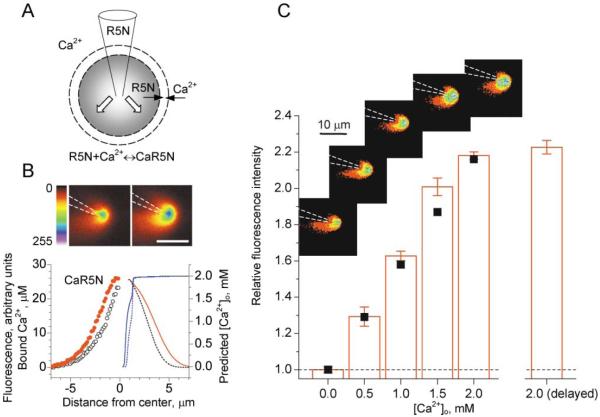
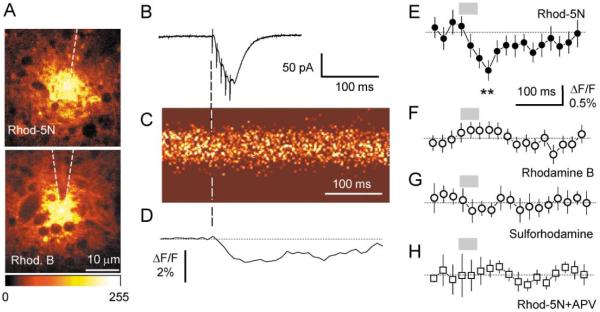
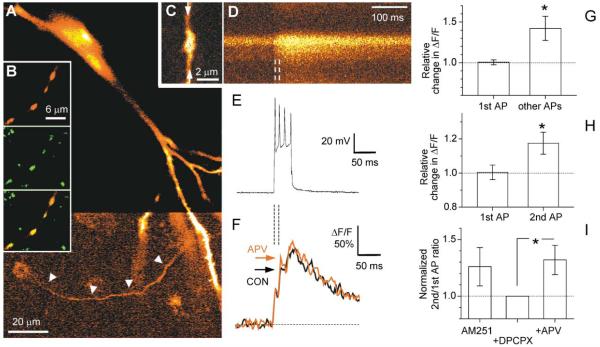
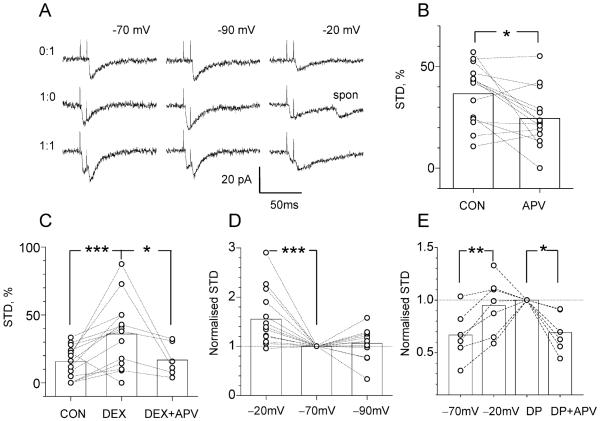
Synaptic activation is associated with rapid changes in intracellular Ca(2+), while the extracellular Ca(2+) level is generally assumed to be constant. Here, using a novel optical method to measure changes in extracellular Ca(2+) at high spatial and temporal resolution, we find that brief trains of synaptic transmission in hippocampal area CA1 induce transient depletion of extracellular Ca(2+). We show that this depletion, which depends on postsynaptic NMDA receptor activation, decreases the Ca(2+) available to enter individual presynaptic boutons of CA3 pyramidal cells. This in turn reduces the probability of consecutive synaptic releases at CA3-CA1 synapses and therefore contributes to short-term paired-pulse depression of minimal responses. This activity-dependent depletion of extracellular Ca(2+) represents a novel form of fast retrograde synaptic signaling that can modulate glutamatergic information transfer in the brain.


Figures

Figure 1
Figure 1. Extracellular Fluorescence Probe
(A) Pressure application of Ca2+ indicator Rhod-5N (R5N; Kd = 0.32 mM) through a pipette results in a three-component diffusion-reaction in the extracellular space, as depicted; white arrows indicate the ejection flux drag; dashed circles illustrate a concentric shell within which diffusion, binding, and unbinding of Rhod-5N molecules and Ca2+ ions are calculated by the model explicitly. (B) (Upper panels) Fluorescence profile near the probe pipette (3 mM Rhod-5N in Ca2+-free ACSF) obtained at two values of applied pressure (+5 kPa and +10 kPa, respectively; [Ca2+ ]o = 2 mM, λex = 810 nm; average of ten frames; scale bar, 10 μm; increasing fluorescence intensity indicated by colors from red through yellow and green to blue). (Graph) Circles (left ordinate, relative units), fluorescence profiles near the pipette tip at 10 kPa (red solid) and 5 kPa (black open); red and black lines (left ordinate, μM), the respective profiles of bound Ca2+ predicted by a multicompartmental model (see Experimental Procedures); to fit the experimental curve, the single unknown/adjustable parameter, the peak ejection rate through the pipette tip, was set at 0.50 m/s (red) and then changed to 0.25 m/s (black) to test the model prediction. Blue lines (solid and dotted, right ordinate), predicted free Ca2+ level at the same model settings. (C) (Insets) Fluorescence profiles near the probe tip (average of ten frames 30 s apart; false colors as above) throughout one experiment at different [Ca2+]o levels, as shown. Graph columns, mean brightness within a 5 μm circle around the pipette tip (average of n = 3 experiments); values are normalized with respect to the baseline level and corrected for focus drift over 20 frames (10 min). The final value [“2.0 mM (delayed)”] was obtained 20 min after the last increase of Ca2+. Black squares, level of bound Ca2+ near the pipette tip (relative values), as predicted by the diffusion model, with parameters as in (B); the two lowest computed values (at [Ca2+]0 = 0 and 0.5 mM) were normalized with respect to the experimental fluorescence values. Scale bars, SEM.
Figure 2
Figure 2. Detection of Extracellular Ca2+ Transient with Fluorescence Probe
(A) Characteristic appearance of extracellular fluorescence near the probe tip ~80 μm deep into the CA1 stratum radiatum area of an acute hippocampal slice; with two-photon excitation at 810 nm. Fluorescence from Ca2+-sensitive (3 mM Rhod-5N, upper panel) and Ca2+-insensitive (3 mM Rhodamine B, lower panel) probes appears similar, with cytosolic compartments visible as dark lacunae; color bar shows fluorescence scale (arbitrary units). (B–D) Five stimuli (100 Hz) applied to stratum radiatum elicited EPCSs in a CA1 pyramidal cell near the probe (trace in [B], recorded in whole-cell mode, Vm = −70mV) and a transient decrease in the Rhod-5N probe fluorescence (line scan image in [C]; individual experiment shown) with an amplitude of ~2% ΔF/F (trace in [D], average of ten scans; five points averaging). (E–H) Average fluorescence transient detected by probe with Rhod-5N ([E], n = 11; asterisks, average fractional fluorescence change, ΔF/F, 45–55 ms after the first stimulus: −0.87% ± 0.21%, p < 0.006), Rhodamine B ([F], n = 9), sulforhodamine ([G], n = 8), and Rhod-5N in the presence of 25 μM D-APV ([H], n = 9). Gray segments indicate application of five stimuli; dotted line, baseline; scale bars, SEM.
Figure 3
Figure 3. The Effect of NMDAR Blockade on Fast, Action Potential-Evoked Ca2+ Transients in Presynaptic Boutons
(A) CA3 pyramidal cell in a cultured hippocampal slice, filled with fluorescent Ca2+ indicator by intracellular injection and imaged by confocal microscopy (488 nm excitation, see Experimental Procedures); color look-up table for the lower half of the image was adjusted to render the axon visible (arrowheads). (B) (Upper panel) Axon segment with four varicosities (2% Cascade blue-biocytin labeling); (middle panel) the same segment labeled for synaptophysin immunoreactivity (SY38 antibody/Cy2-labeled IgG); (lower panel) overlay of the two upper images, with precise colocalization indicating that the varicosities are synaptic terminals; see Experimental Procedures for details. (C) Axonal bouton (CA3 pyramidal cell, acute slice) imaged using Alexa Fluor 594 coinjected with Ca2+ indicator Fluo-4 (two-photon excitation at 810 nm); arrows, trajectory of the line scan in (D). (D and E) Line scan of the Ca2+ indicator fluorescence transient ([D], average of ten traces; increasing fluorescence intensity indicated by colors from red through yellow to white) evoked by the brief train of action potentials shown in the simultaneous whole-cell current clamp recording (E). (F) Average fluorescence (ΔF/F) in line scans (average of ten traces) of the bouton illustrated in (C) and (D), before (black line, CON) and after (red line, APV) application of 25 μM D-APV; arrows indicate peak fluorescence responses to the second spike. (G) Average changes (relative to control) in AP-evoked bouton Ca2+ fluorescence monitored in hippocampal slice cultures, following application of 25 μM D-APV. 1st AP, average change in ΔF/F corresponding to the 1st spike (+0.5% ± 3.0%, n = 11; integrated over 0–10 ms after stimulus onset); Other APs, average change in the ratio between ΔF/F integrated over 10–100 ms after stimulus onset and ΔF/F integrated over 0–10 ms after stimulus onset (+42% ± 15%, p < 0.024, n = 11); single-photon excitation at 488 nm. (H) Average changes in AP-evoked bouton Ca2+ fluorescence monitored in acute hippocampal slices, following application of 25 μM D-APV. 1st AP, average change in ΔF/F corresponding to the 1st spike (+0.4% ± 4.3%, integrated over 0–8 ms after the 1st spike onset; n = 10); 2nd AP, average change in the ratio between ΔF/F signals corresponding to the 2nd spike (integrated over 0–20 ms after the 2nd spike onset) and 1st spikes (+17% ± 6%, p < 0.022, n = 10); two-photon excitation at 810 nm. (I) Blockade of adenosine and cannabinoid receptors does not affect NMDAR-dependent changes in Ca2+ transients. In acute slices incubated with 2 μM AM251, further incubation with 2 μM DPCPX reduces (insignificantly) the 2nd/1st ΔF/F (change −20% ± 14%, n = 6; see text), while the effect of APV remains (change +32% ± 14%, p < 0.05, n = 7). Dotted line, baseline level; scale bars, SEM.
Figure 4
Figure 4. Short-Term Paired-Pulse Depression Involves Postsynaptic NMDA Receptors, in a Voltage-Dependent Manner
(A) Examples of single quantum EPSCs elicited by minimal stimulation with two stimuli 8 ms apart, at holding voltage of −70mV, −90mV, and −20mV, as indicated, in the same cell; three characteristic types (0:1, 1:0, 1:1) of successful response are shown (double failure, 0:0, response is not shown); spon, spontaneous EPSC that appears identical to the minimal evoked EPSC. (B) APV decreases STD (see Experimental Procedures) by 26% ± 11% (p < 0.012, n = 14; cultured slices), with no effect on the baseline release probability (pr: 0.44 ± 0.04 and 0.42 ± 0.04, respectively). (C) Dextran increases STD by 137% ± 41% (p < 0.01, n = 14; acute slices), with no effect on the baseline release probability (pr: 0.48 ± 0.04, 0.48 ± 0.05, and 0.42 ± 0.06, respectively); the effect of dextran is reversed by addition of APV (p < 0.024, n = 6; acute slices). (D) Changing the holding voltage from −70mV to −20mV increases STD by 55.4% ± 15.0% (p < 0.005, n = 14; acute slices), whereas a change from −70mV to −90mV has no effect (change 6.0% ± 8.5%, n = 13; acute slices); data are normalized with respect to the baseline STD (at −70mV) in each cell. Throughout the experiments, the STD occurred against a background of baseline paired-pulse facilitation, with the absolute probability ratio “2nd EPSC/1st EPSC” of 1.42 ± 0.11 (series in [B]), 1.85 ± 0.19 (C), and 1.42 ± 0.14 (D). (E) Activation of presynaptic adenosine or cannabinoid receptors does not affect NMDAR-dependent STD. In acute slices (preincubated in 2 μM AM251), increase in STD from −70mV to −20mV (change +39% ± 11%, p < 0.008, n = 6) is not reversed by incubation in 2 μM DPCPX (DP; change +14% ± 13%, n = 7) but is reversed by application of APV (DP + APV; change −31% ± 8%, p < 0.05, n = 6).

Similar articles

Cited by

References

    1. Baskys A, Malenka RC. Agonists at metabotropic glutamate receptors presynaptically inhibit EPSCs in neonatal rat hippocampus. J. Physiol. 1991;444:687–701. - PMC - PubMed
    1. Bellingham MC, Walmsley B. A novel presynaptic inhibitory mechanism underlies paired pulse depression at a fast central synapse. Neuron. 1999;23:159–170. - PubMed
    1. Berretta N, Rossokhin AV, Kasyanov AM, Sokolov MV, Cherubini E, Voronin LL. Postsynaptic hyperpolarization increases the strength of AMPA-mediated synaptic transmission at large synapses between mossy fibers and CA3 pyramidal cells. Neuropharmacology. 2000;39:2288–2301. - PubMed
    1. Borst JGG, Sakmann B. Depletion of calcium in the synaptic cleft of a calyx-type synapse in the rat brain stem. J. Physiol. 1999;521:123–133. - PMC - PubMed
    1. Brown EM, Vassiliev PM, Hebert SC. Calcium ions as extracellular messengers. Cell. 1995;83:679–682. - PubMed

Publication types

MeSH terms

LinkOut - more resources