

Distinct transcriptional profiles of adrenocortical tumors uncovered by DNA microarray analysis
- PMID: 12547710
- PMCID: PMC1851158
- DOI: 10.1016/S0002-9440(10)63846-1
Distinct transcriptional profiles of adrenocortical tumors uncovered by DNA microarray analysis
Abstract
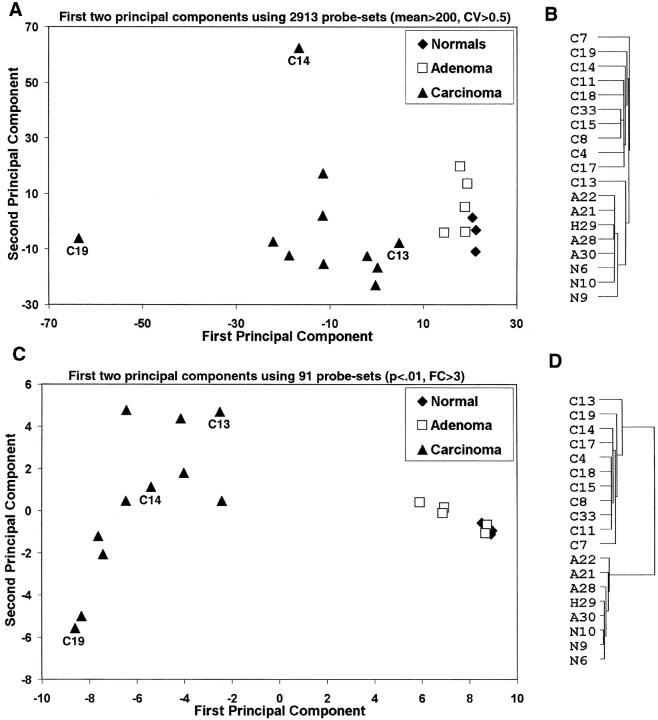
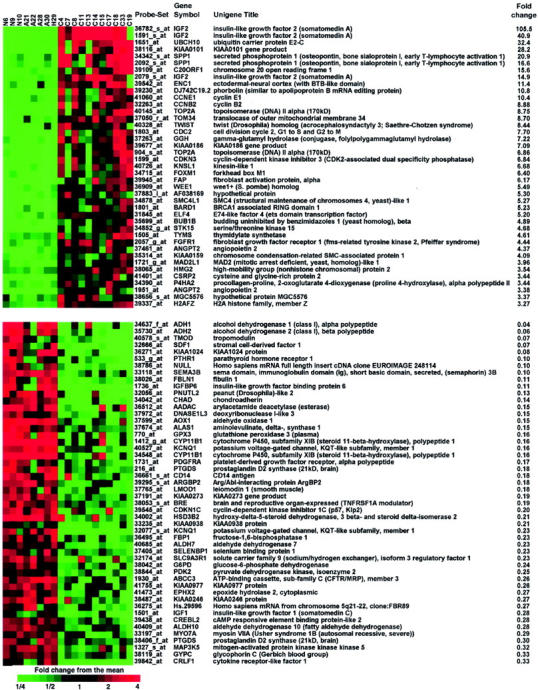
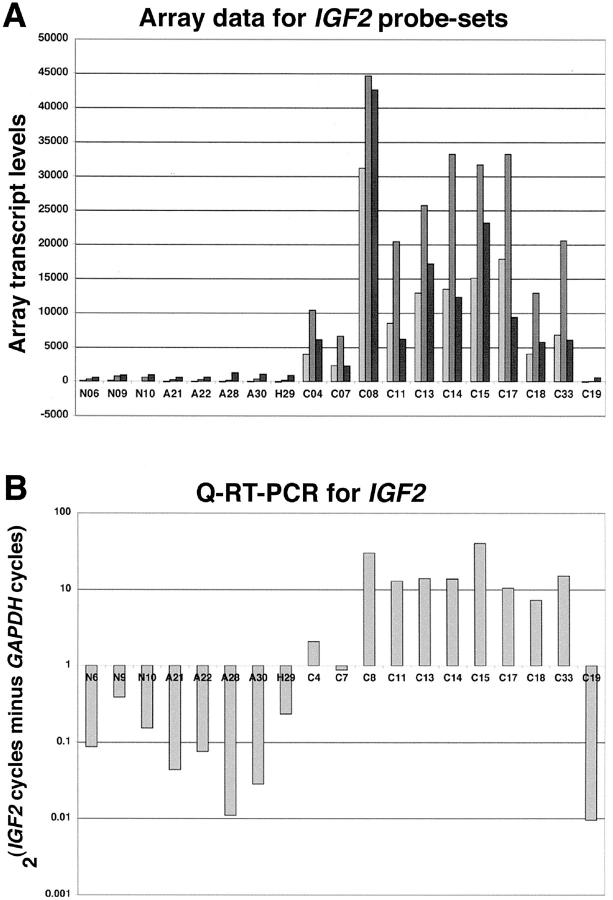
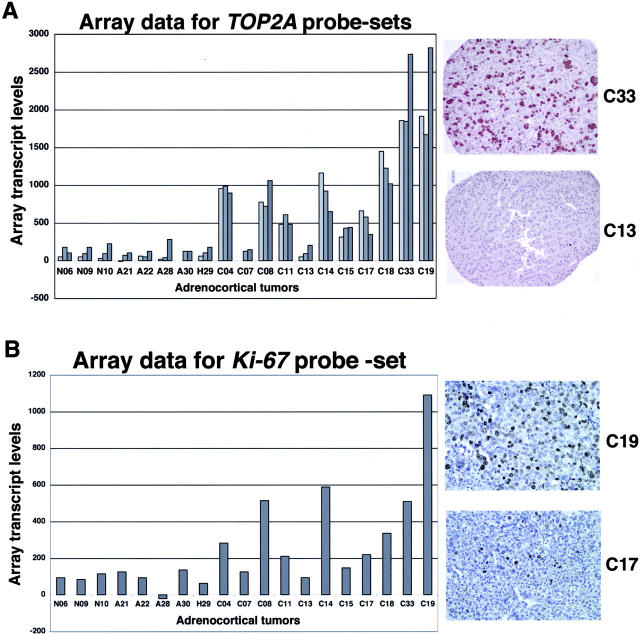
Comprehensive expression profiling of tumors using DNA microarrays has been used recently for molecular classification and biomarker discovery, as well as a tool to identify and investigate genes involved in tumorigenesis. Application of this approach to a cohort of benign and malignant adrenocortical tissues would be potentially informative in all of these aspects. In this study, we generated transcriptional profiles of 11 adrenocortical carcinomas (ACCs), 4 adrenocortical adenomas (ACAs), 3 normal adrenal cortices (NCs), and 1 macronodular hyperplasia (MNH) using Affymetrix HG_U95Av2 oligonucleotide arrays representing approximately 10,500 unique genes. The expression data set was used for unsupervised hierarchical cluster analysis as well as principal component analysis to visually represent the expression data. An analysis of variance on the three classes (NC, ACA plus MNH, and ACC) revealed 91 genes that displayed at least threefold differential expression between the ACC cohort and both the NC and ACA cohorts at a significance level of P < 0.01. Included in these 91 genes were those known to be up-regulated in adrenocortical tumors, such as insulin-like growth factor (IGF2), as well as novel differentially expressed genes such as osteopontin (SPP) and serine threonine kinase 15 (STK15). Increased expression of IGF2 was identified in 10 of 11 ACCs (90.9%) and was verified by quantitative reverse transcriptase-polymerase chain reaction. Select proliferation-related genes (TOP2A and Ki-67) were validated at the protein level using immunohistochemistry and adrenocortical tissue microarrays. Our results demonstrated significant and consistent gene expression changes in ACCs compared to benign adrenocortical lesions. Moreover, we identified several genes that represent potential diagnostic markers and may play a role in the pathogenesis of ACC.
Figures
References
-
- Brennan MF: Adrenocortical carcinoma. CA Cancer J Clin 1987, 37:348-365 - PubMed
-
- Weiss LM: Comparative histologic study of 43 metastasizing and nonmetastasizing adrenocortical tumors. Am J Surg Pathol 1984, 8:163-169 - PubMed
-
- Weiss LM, Medeiros LJ, Vickery AL, Jr: Pathologic features of prognostic significance in adrenocortical carcinoma. Am J Surg Pathol 1989, 13:202-206 - PubMed
-
- Munro LM, Kennedy A, McNicol AM: The expression of inhibin/activin subunits in the human adrenal cortex and its tumours. J Endocrinol 1999, 161:341-347 - PubMed
Publication types
MeSH terms
Substances
Grants and funding
LinkOut - more resources
Full Text Sources
Other Literature Sources
Research Materials
Miscellaneous
