Comparative Study
. 2003 Feb;84(2 Pt 1):1031-7.
doi: 10.1016/S0006-3495(03)74919-4.

Structural proton diffusion along lipid bilayers

Affiliations
Comparative Study

Structural proton diffusion along lipid bilayers

Steffen Serowy et al. Biophys J. 2003 Feb.

Abstract

For H(+) transport between protein pumps, lateral diffusion along membrane surfaces represents the most efficient pathway. Along lipid bilayers, we measured a diffusion coefficient of 5.8 x 10(-5) cm(2) s(-1). It is too large to be accounted for by vehicle diffusion, considering proton transport by acid carriers. Such a speed of migration is accomplished only by the Grotthuss mechanism involving the chemical exchange of hydrogen nuclei between hydrogen-bonded water molecules on the membrane surface, and the subsequent reorganization of the hydrogen-bonded network. Reconstitution of H(+)-binding sites on the membrane surface decreased the velocity of H(+) diffusion. In the absence of immobile buffers, structural (Grotthuss) diffusion occurred over a distance of 100 micro m as shown by microelectrode aided measurements of the spatial proton distribution in the immediate membrane vicinity and spatially resolved fluorescence measurements of interfacial pH. The efficiency of the anomalously fast lateral diffusion decreased gradually with an increase in mobile buffer concentration suggesting that structural diffusion is physiologically important for distances of approximately 10 nm.


Figures

FIGURE 1
FIGURE 1
(A) A microelectrode (ME) consisting of pH- and Ca2+-sensitive barrels was moved at 2 μm/s perpendicular to the lipid plane formed by the bilayer itself, the torus, and the lipid on the Teflon support. (B) Representative experimental records induced by 2.5 μM A23187 in the presence of a 2:0.2 mM transmembrane [Ca2+] gradient (bulk solution: 1 mM Tris, 1 mM Mes, 100 mM choline chloride, pH 7). After touching the membrane, the electrode was withdrawn to a distance of 20 μm. Switching the transmembrane potential from 0 to +150 and then −150 mV revealed no effect, suggesting that the Ca2+/2H+ exchange is electroneutral.
FIGURE 2
FIGURE 2
(A) pH and [Ca2+] profiles indicating identical transmembrane Ca2+ and H+ flux densities in the membrane center. (B) From the lipid covering the Teflon support, a significant H+ release but no Ca2+ release (zero first derivative at the interface) was measured. (C) The interfacial pH and [Ca2+] shifts at distance d from the membrane center relative to the respective values at d = 0. Increasing of Tris concentration from 1 mM (circles) to 36 mM (squares) restricted proton release to the lipid bilayer. Bulk solution: 100 mM choline chloride, 4 μM A23187, pH 7.0. CaCl2-concentration gradient: 20:0.1 mM.
FIGURE 3
FIGURE 3
(A) Using a set of diaphragms, two regions of the membrane (large circle) were selected that were exposed to the UV flash or used for fluorescence measurements. (B) Different kinetics of flash triggered fluorescence changes at a distance s = 70 μm between both regions in the case of 1 mM caged H+ (blue) or 1 mM caged fluorescein (green) corresponding, respectively, to two-dimensional surface diffusion (Ds = 5.8 × 10⁻⁵ cm2/s) and three-dimensional bulk diffusion (Db = 2.8 × 10⁻⁶ cm2/s). In the former case fluorescence was collected from fluorescein labeled lipids (5%) incorporated into the membrane. Bulk solution: 100 mM NaCl, 0.1 (for H+) or 1 mM (for fluorescein) 1 mM CAPSO. The fit of the Monte Carlo simulations to the experimental data is shown by red triangles.
FIGURE 4
FIGURE 4
Kinetics of pH changes in an observation area on the membrane surface as a function of its distance s to the area of proton release. The maximum of fluorescence (i.e., the peak of the surface proton concentration in the observation area) appeared with a delay τmax after proton uncaging. τmax was a linear function of s2. In this plot, the shades of gray of the circles correspond to the shade of gray of representative experimental traces recorded at s = 60, 77, 100, and 125 μm. For clarity, the experimental records corresponding to the triangles are omitted.
FIGURE 5
FIGURE 5
Mobile buffer concentration determined the kinetics of pH changes in the observation area that was located on the membrane surface at a distance of 73 μm to the area of proton release. τmax was a linear function of the buffer concentration. From the regression, a rough estimate of Ds (s2/4τmax = 8.3 × 10⁻⁵ cm2 s−1) at infinite buffer dilution can be made, if it is assumed that H+ release and observation areas are point like. The shades of gray of the circles correspond to the shades of gray of representative experimental traces recorded for 0.1, 0.5, and 0.9 mM CAPSO (pH 9.0). For clarity, the experimental records corresponding to the empty circles are omitted.
FIGURE 6
FIGURE 6
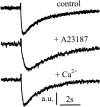
Effect of A23187 on the kinetics of pH changes in an observation area (s = 73 μm) on the membrane surface. Addition of 10 μM A23187 to the bathing solution (100 mM NaCl, 100 μM CAPSO) resulted in a retarded appearance of the fluorescence peak. Fitting the theoretical time course calculated by the Monte Carlo algorithm to the experimental data revealed a Ds of 2.0 × 10⁻⁵ cm2 s−1. Subsequent addition of 100 μM Ca2+ that competed with H+ for binding to A23187 reversed the effect (Ds = 5.8 × 10⁻⁵ cm2 s−1).

References

    1. Alexiev, U., R. Mollaaghababa, P. Scherrer, H. G. Khorana, and M. P. Heyn. 1995. Rapid long-range proton diffusion along the surface of the purple membrane and delayed proton transfer into the bulk. Proc. Natl. Acad. Sci. USA. 92:372–376. - PMC - PubMed
    1. Amman, D. 1986. Ion-Selective Microelectrodes. Principles, Design and Application. Springer, Berlin.
    1. Antonenko, Y. N., and A. A. Bulychev. 1991. Measurements of local pH changes near bilayer lipid membrane by means of a pH microelectrode and a protonophore-dependent membrane potential - comparison of the methods. Biochim. Biophys. Acta. 1070:279–282. - PubMed
    1. Antonenko, Y. N., O. N. Kovbasnjuk, and L. S. Yaguzhinsky. 1993. Evidence in favor of the existence of a kinetic barrier for proton transfer from a surface of bilayer phospholipid membrane to bulk water. Biochim. Biophys. Acta. 1150:45–50. - PubMed
    1. Antonenko, Y. N., and P. Pohl. 1998. Coupling of proton source and sink via H+-migration along the membrane surface as revealed by double patch-clamp experiments. FEBS Lett. 429:197–200. - PubMed

Publication types

LinkOut - more resources