. 2003 Feb;84(2 Pt 1):1308-16.
doi: 10.1016/S0006-3495(03)74946-7.

Laser-induced heating in optical traps

Affiliations

Laser-induced heating in optical traps

Erwin J G Peterman et al. Biophys J. 2003 Feb.

Abstract

In an optical tweezers experiment intense laser light is tightly focused to intensities of MW/cm(2) in order to apply forces to submicron particles or to measure mechanical properties of macromolecules. It is important to quantify potentially harmful or misleading heating effects due to the high light intensities in biophysical experiments. We present a model that incorporates the geometry of the experiment in a physically correct manner, including heat generation by light absorption in the neighborhood of the focus, balanced by outward heat flow, and heat sinking by the glass surfaces of the sample chamber. This is in contrast to the earlier simple models assuming heat generation in the trapped particle only. We find that in the most common experimental circumstances, using micron-sized polystyrene or silica beads, absorption of the laser light in the solvent around the trapped particle, not in the particle itself, is the most important contribution to heating. To validate our model we measured the spectrum of the Brownian motion of trapped beads in water and in glycerol as a function of the trapping laser intensity. Heating both increases the thermal motion of the bead and decreases the viscosity of the medium. We measured that the temperature in the focus increased by 34.2 +/- 0.1 K/W with 1064-nm laser light for 2200-nm-diameter polystyrene beads in glycerol, 43.8 +/- 2.2 K/W for 840-nm polystyrene beads in glycerol, 41.1 +/- 0.7 K/W for 502-nm polystyrene beads in glycerol, and 7.7 +/- 1.2 K/W for 500-nm silica beads and 8.1 +/- 2.1 K/W for 444-nm silica beads in water. Furthermore, we observed that in glycerol the heating effect increased when the bead was trapped further away from the cover glass/glycerol interface as predicted by the model. We show that even though the heating effect in water is rather small it can have non-negligible effects on trap calibration in typical biophysical experimental circumstances and should be taken into consideration when laser powers of more than 100 mW are used.


Figures
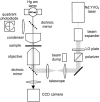
FIGURE 1
FIGURE 1
Schematic representation of the optical trap. The beam from a Nd:YVO4 laser (1064 nm) is expanded with a beam expander and the power is regulated using the combination of a half-wave plate and a polarizer. After passing through a telescope, the first lens of which can be moved to reposition the trap, and being reflected by a dichroic mirror, the beam is focused into the sample with a microscope objective. This optical-trap beam path is represented by the gray line. The light which passes the sample is collected by a condenser, the back-focal plane of which is imaged onto a quadrant photodiode. This trap detection beam path is represented by the dashed gray line. For completeness, the ordinary image path is also shown (black arrow), which is formed by an Hg arc lamp which illuminates the sample via the condenser. The transmitted light is collected by the objective and imaged onto a tube camera. This (visible) beam is separated from the laser beam (1064 nm) by dichroic mirrors. For details, see text.
FIGURE 2
FIGURE 2
Transmitted laser power as a function of path length in water (circles) and glycerol (squares). The data are fitted (solid and dotted lines for water and glycerol, respectively) by the exponential function: I(x) = I0 × eαx. The constant, α, was determined to be 14.2 m−1 for water and 21.4 m−1 for glycerol.
FIGURE 3
FIGURE 3
Power spectra of the Brownian motion of a trapped, 502-nm-diameter polystyrene bead in glycerol. The laser power was as indicated. The lines represent fits of Eq. 1 to the data. In (a) the whole spectra are shown; in (b) the high frequency regions of the spectra, where temperature effects are most clearly visible, are enlarged (see text).
FIGURE 3
FIGURE 3
Power spectra of the Brownian motion of a trapped, 502-nm-diameter polystyrene bead in glycerol. The laser power was as indicated. The lines represent fits of Eq. 1 to the data. In (a) the whole spectra are shown; in (b) the high frequency regions of the spectra, where temperature effects are most clearly visible, are enlarged (see text).
FIGURE 4
FIGURE 4
Laser-power dependence of the parameters obtained by fitting the power spectra of the Brownian motion of a trapped, 502-nm-diameter polystyrene bead in glycerol (a) and (b) and a 444-nm-diameter silica bead in water (c) and (d) at a distance of 10 μm from the glass solvent interface: a and c the laser power divided by the corner frequency (line, fit of data by Eq. 2); b and d the reciprocal of the product of the square of the corner frequency and the zero-frequency intercept (line, fit of data by Eq. 3). (e) Dependence of the laser-induced heating on the distance of a 502-nm-diameter polystyrene bead from the glycerol–cover glass interface. The circles are the data; the line is a plot of Eq. 8, assuming a symmetrical cutoff R equal to the shortest distance to the glass.
FIGURE 4
FIGURE 4
Laser-power dependence of the parameters obtained by fitting the power spectra of the Brownian motion of a trapped, 502-nm-diameter polystyrene bead in glycerol (a) and (b) and a 444-nm-diameter silica bead in water (c) and (d) at a distance of 10 μm from the glass solvent interface: a and c the laser power divided by the corner frequency (line, fit of data by Eq. 2); b and d the reciprocal of the product of the square of the corner frequency and the zero-frequency intercept (line, fit of data by Eq. 3). (e) Dependence of the laser-induced heating on the distance of a 502-nm-diameter polystyrene bead from the glycerol–cover glass interface. The circles are the data; the line is a plot of Eq. 8, assuming a symmetrical cutoff R equal to the shortest distance to the glass.
FIGURE 5
FIGURE 5
(a) Position time trace of a 502-nm-diameter polystyrene bead in glycerol when periodically moving the sample back and forth at 0.1 Hz with constant speed 910 nm/s. (b) Position histogram of the time trace in a. (c) Laser-power dependence of the product of laser power and displacement out of the laser trap as determined from histograms as in b. Circles represent the data, the line represents a fit of the data by Eq. 5.
FIGURE 5
FIGURE 5
(a) Position time trace of a 502-nm-diameter polystyrene bead in glycerol when periodically moving the sample back and forth at 0.1 Hz with constant speed 910 nm/s. (b) Position histogram of the time trace in a. (c) Laser-power dependence of the product of laser power and displacement out of the laser trap as determined from histograms as in b. Circles represent the data, the line represents a fit of the data by Eq. 5.
FIGURE 6
FIGURE 6
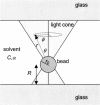
Schematic representation of the experimental situation considered in the model. For details, see text.

References

    1. Allersma, M. W., F. Gittes, M. J. deCastro, R. J. Stewart, and C. F. Schmidt. 1998. Two-dimensional tracking of NCD motility by back focal plane interferometry. Biophys. J. 74:1074–1085. - PMC - PubMed
    1. Ashkin, A. 1997. Optical trapping and manipulation of neutral particles using lasers. Proc. Natl. Acad. Sci. USA. 94:4853–4860. - PMC - PubMed
    1. Ashkin, A., J. M. Dziedzic, and T. Yamane. 1987. Optical trapping and manipulation of single cells using infrared laser beams. Nature. 330:769–771. - PubMed
    1. Block, S. M. 1990. Optical tweezers: a new tool for biophysics. In Noninvasive Techniques in Cell Biology. S. Grinstein, K. Foskett, editors. Wiley-Liss, New York, New York. 375–401.
    1. Daubert, T. E., and R. P. Danner. 1989. Physical and Thermodynamic Properties of Pure Chemicals: Data Compilation. Hemisphere Pub. Corp., New York, New York.

Publication types

LinkOut - more resources