. 2003 Feb 4;100(3):1232-7.
doi: 10.1073/pnas.0337418100. Epub 2003 Jan 23.

Quantitative imaging of the T cell antitumor response by positron-emission tomography

Affiliations

Quantitative imaging of the T cell antitumor response by positron-emission tomography

Purnima Dubey et al. Proc Natl Acad Sci U S A. .

Abstract

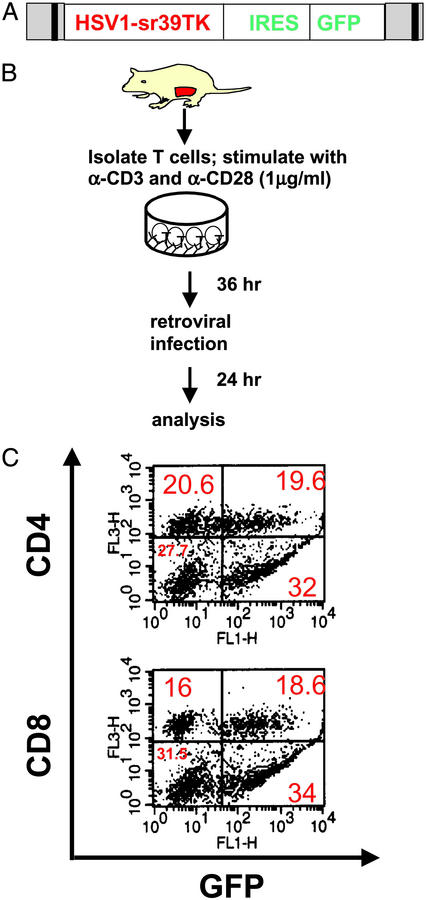
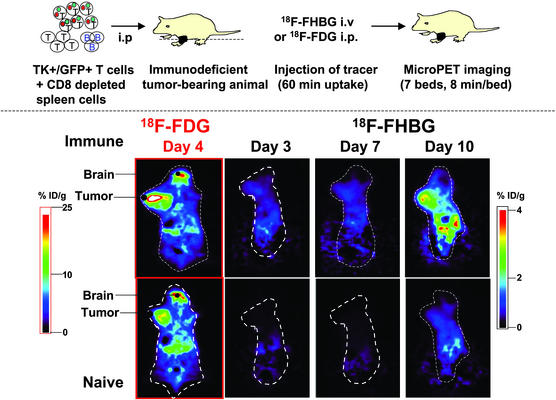
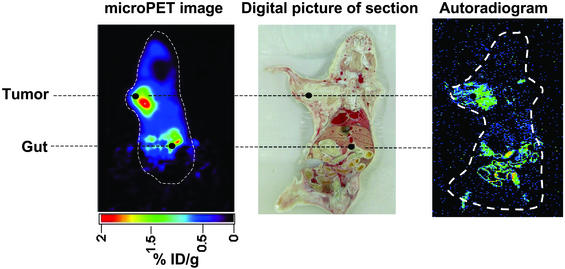
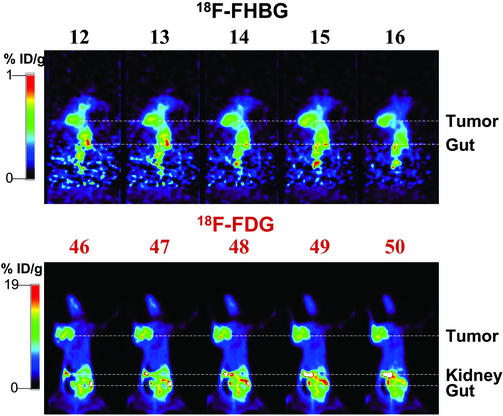
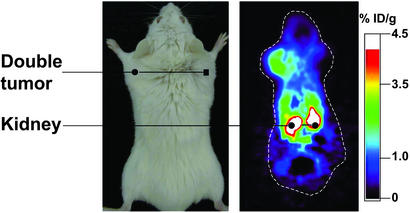
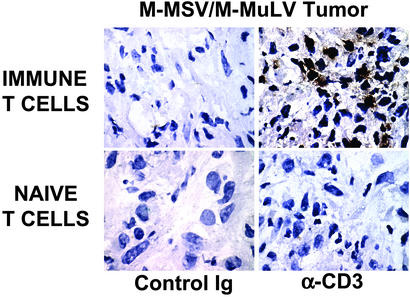
We describe a noninvasive, quantitative, and tomographic method to visualize lymphocytes within the whole animal. We used positron-emission tomography (PET) to follow the localization of adoptively transferred immune T lymphocytes. Splenic T cells from animals that had rejected a Moloney murine sarcoma virus/Moloney murine leukemia virus (M-MSV/M-MuLV)-induced tumor were marked with a PET reporter gene, injected into tumor-bearing mice, and imaged in a microPET by using a substrate specific for the reporter. Specific localization of immune T cells to the antigen-positive tumor was detected over time, by sequential imaging of the same animals. Naive T cells did not localize to the tumor site, indicating that preimmunization was required. Autoradiography and immunohistochemistry analysis corroborated the microPET data. The method we have developed can be used to assess the effects of immunomodulatory agents intended to potentiate the immune response to cancer, and can also be useful for the study of other cell-mediated immune responses, including autoimmunity.


Figures

Figure 1
Figure 1
Splenic T cells are efficiently infected with retrovirus. (A) MSCV-sr39TK-IRES-GFP retroviral construct used for infection of total splenic T lymphocytes. (B) Purified T cells were stimulated to proliferate, then infected with the MSCV-sr39TK-IRES-GFP retrovirus. (C) Infected T cells were stained with α-CD4 or α-CD8 antibodies then analyzed by two-color flow cytometry.
Figure 2
Figure 2
Immune, but not naive, lymphocytes migrate to the M-MSV/M-MuLV tumor. Immunodeficient CB-17SCID/SCID female mice were injected with M-MSV/M-MuLV. HSV1-sr39TK-marked T cells (1.5–5 × 10⁶) were injected i.p. when tumors measured at least 0.25 cm3. As a source of help, 1 × 10⁷ CD8+ T cell-depleted splenocytes (immune or naive) were also injected i.p. For microPET imaging, animals were injected i.v. with [18F]FHBG and i.p. with [18F]FDG, then imaged as described in Materials and Methods. [18F]FHBG and [18F]FDG scans were performed at least 24 hr apart. Data were reconstructed by using the map algorithm for image presentation (17) and filtered back projection for quantitation. % ID/g, percent ID per gram of tissue. Each pair of images is an average of five consecutive planes with the greatest signal in the region of interest, and is presented on the same common global maximum. The highest pixel values on the image are shown by white, and the lowest pixel values are shown by black.
Figure 3
Figure 3
Anatomical corroboration of the microPET signal by digital whole-body autoradiography. On day 11 after T cell transfer, one animal injected with immune T cells was injected in the tail vein with 2 μCi of [14C]FIAU. After 24 hr had been allowed for uptake of the tracer and removal of untrapped radioactivity from the bloodstream and other tissues, a microPET scan using [18F]FHBG was performed on day 12. The PET camera does not detect the incorporated [14C]FIAU. The animal was then killed and processed for autoradiography. When sections were exposed to the imaging plate the [18F]FHBG signal had decayed and did not interfere with the [14C]FIAU signal. (Left) Day 12 microPET image. (Center) Digital picture of the section exposed to the autoradiography plate. (Right) Autoradiogram image exposed to the plate for 7 days. The highest amount of radioactivity present in the image is indicated by red, and the lowest amount of radioactivity present is indicated by black.
Figure 4
Figure 4
Analysis of sequential panels of [18F]FHBG and [18F]FDG images demonstrating the three-dimensional capacity of microPET analysis. Shown are [18F]FHBG and [18F]FDG images of a M-MSV/M-MuLV tumor-bearing animal injected with immune HSV1-sr39TK-marked T cells. [18F]FHBG (Upper) and [18F]FDG (Lower) images show five consecutive planes in the region of the tumor. Slices through serial planes of interest allow three-dimensional image analysis. Images presented were reconstructed by using the MAP algorithm.
Figure 5
Figure 5
Immune T cells migrate specifically to the antigen-positive tumor. (Right) An animal bearing the M-MSV/M-MuLV-induced tumor and P815 tumor was imaged by using [18F]FHBG. A stronger signal was detected in the antigen-positive tumor. The average of five planes that had the greatest signal in the region of interest is presented. (Left) For orientation, a picture of the tumor-bearing animal.
Figure 6
Figure 6
α-CD3 staining of tumor sections detects greater numbers of immune T cells in the antigen-positive tumor. Shown is staining of tumor sections from animals that bore the M-MSV/M-MuLV tumor. More T cells are detected in the tumor of the animal that received immune T cells than in the animal that received naive T cells. (×1,000.)

References

    1. Schreiber H. In: Fundamental Immunology. Paul W E, editor. Philadelphia: Lippincott-Raven; 1999. pp. 1237–1270.
    1. Rosenberg S A. Nature. 2001;411:380–384. - PubMed
    1. Ross J S, Sheehan C E, Fisher H A, Kauffman R A, Dolen E M, Kallakury B V. Expert Rev Mol Diagn. 2002;2:129–142. - PubMed
    1. Gambhir S S. Nat Rev Cancer. 2002;2:683–693. - PubMed
    1. Phelps M E. Proc Natl Acad Sci USA. 2000;97:9226–9233. - PMC - PubMed

Publication types

MeSH terms

LinkOut - more resources