. 2003 Feb;77(4):2717-29.
doi: 10.1128/jvi.77.4.2717-2729.2003.

Structure and mechanism of a coreceptor for infection by a pathogenic feline retrovirus

Affiliations

Structure and mechanism of a coreceptor for infection by a pathogenic feline retrovirus

Anna L Barnett et al. J Virol. 2003 Feb.

Abstract

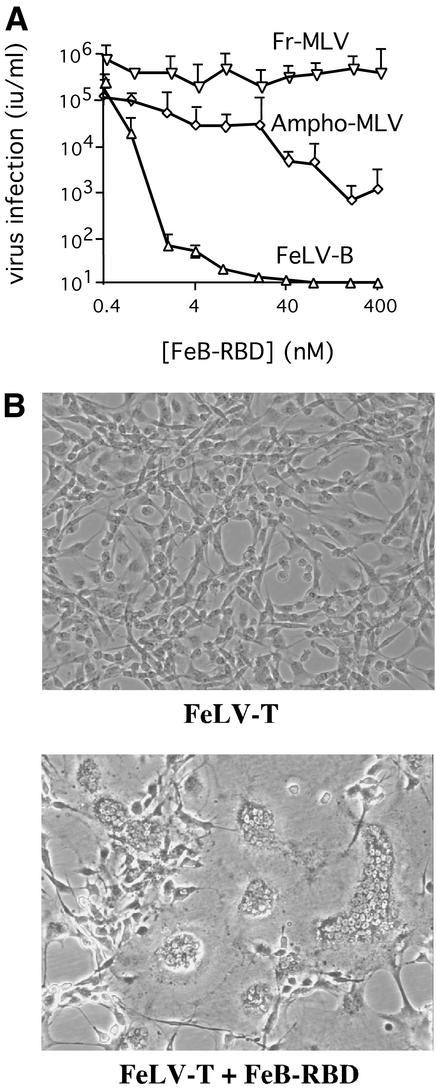
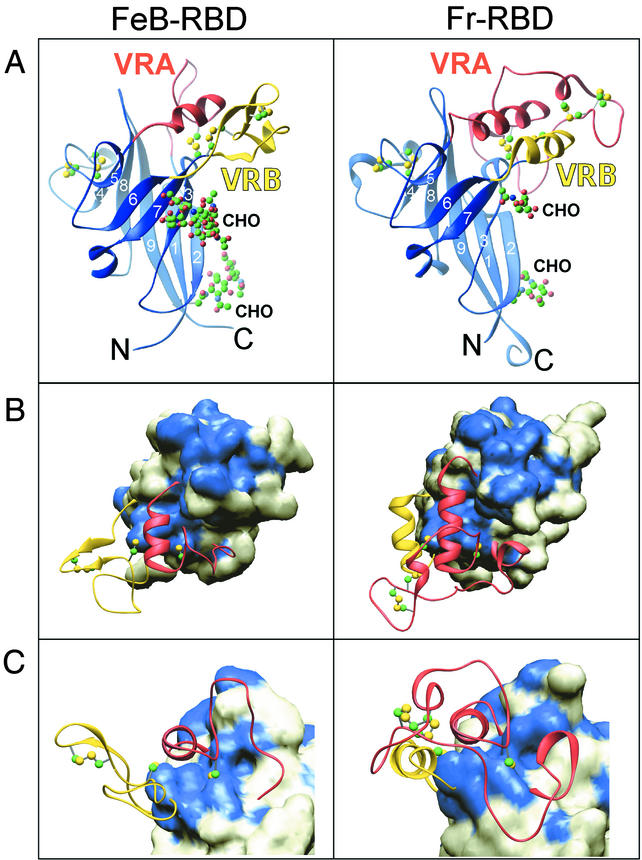
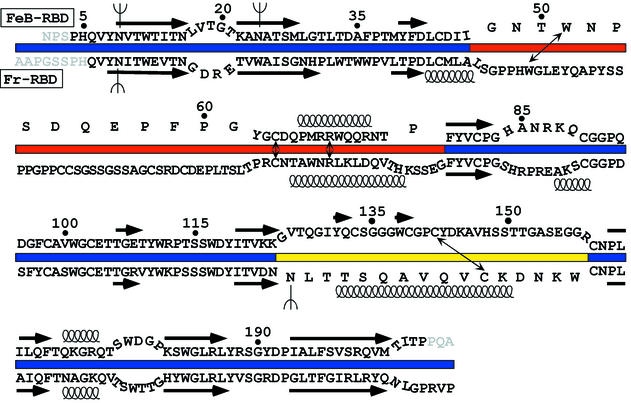
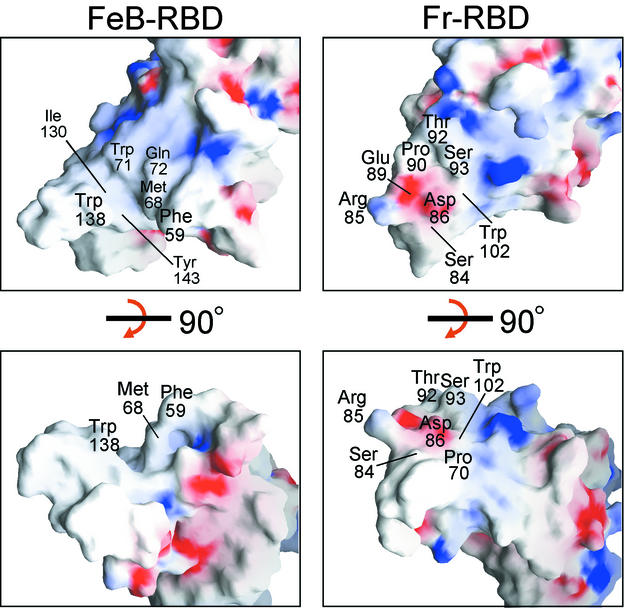
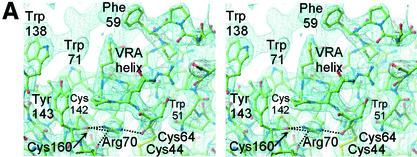
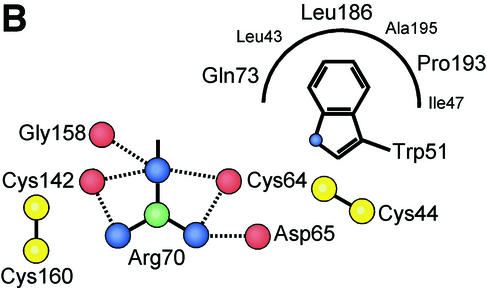
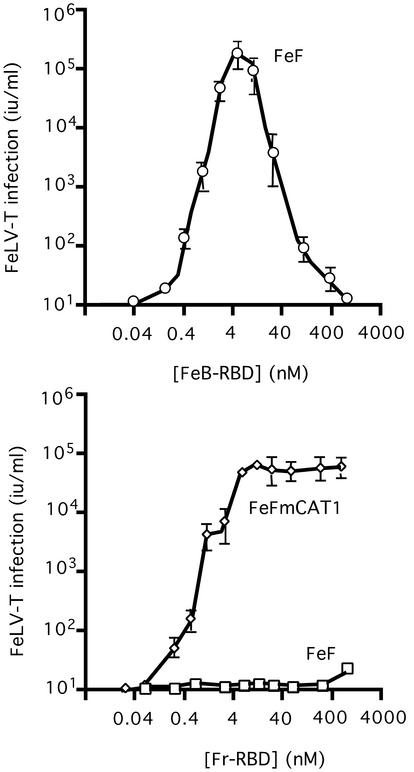
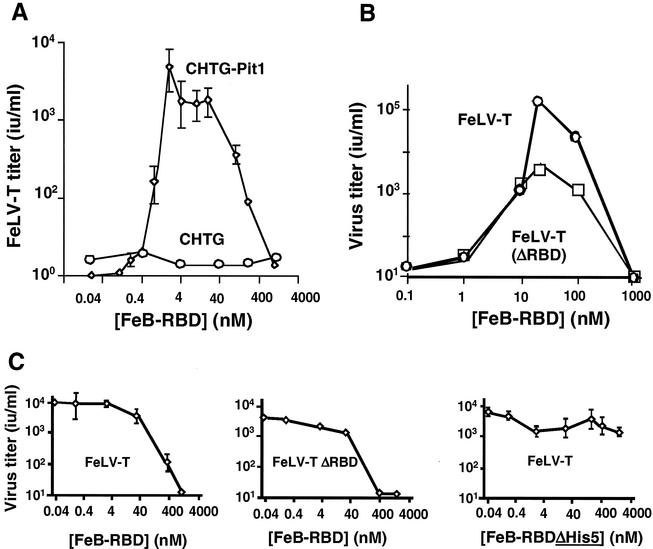
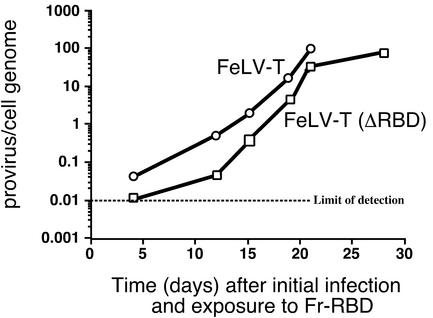
Infection of T lymphocytes by the cytopathic retrovirus feline leukemia virus subgroup T (FeLV-T) requires FeLIX, a cellular coreceptor that is encoded by an endogenous provirus and closely resembles the receptor-binding domain (RBD) of feline leukemia virus subgroup B (FeLV-B). We determined the structure of FeLV-B RBD, which has FeLIX activity, to a 2.5-A resolution by X-ray crystallography. The structure of the receptor-specific subdomain of this glycoprotein differs dramatically from that of Friend murine leukemia virus (Fr-MLV), which binds a different cell surface receptor. Remarkably, we find that Fr-MLV RBD also activates FeLV-T infection of cells expressing the Fr-MLV receptor and that FeLV-B RBD is a competitive inhibitor of infection under these conditions. These studies suggest that FeLV-T infection relies on the following property of mammalian leukemia virus RBDs: the ability to couple interaction with one of a variety of receptors to the activation of a conserved membrane fusion mechanism. A comparison of the FeLV-B and Fr-MLV RBD structures illustrates how receptor-specific regions are linked to conserved elements critical for postbinding events in virus entry.


Figures

FIG. 1.
FIG. 1.
FeB-RBD binds to receptor and activates FeLV-T infection. (A) Recombinant FeB-RBD was expressed and purified. Receptor-binding activity was assessed by a competition assay using FeLV-B, Fr-MLV, and amphotropic MLV. Serial dilutions of each virus were applied to permissive human 293mCAT1 cells, and infection was measured as a function of FeB-RBD concentration (0 to 400 nM) added to the medium at the time of infection. The virus titer was determined byendpoint dilution in triplicate and is expressed as infectious units/milliliter ± one standard error. (B) FeB-RBD (40 nM) was added to the culture medium of one of two flasks containing FeF fibroblasts (5 × 10⁵ cells) exposed to FeLV-T at a multiplicity of infection of 0.01. After 7 days, both the FeB-RBD-treated and the untreated control cells were removed by using Versene-phosphate-buffered saline and then replated (1:3) in fresh medium. Fresh FeB-RBD was added to the medium of the previously treated cells. After a further 24 h, the cells were examined and photographed through a phase-contrast microscope. Magnification, ×400.
FIG.2.
FIG.2.
FeB-RBD (left) and Fr-RBD (right) structures. This figure was prepared by using Ribbons (11). (A) Ribbon diagram of the two RBD structures, with conserved scaffolds in blue, VRA in red, and VRB in yellow. The strands are numbered according to their order in the primary sequences. Cysteine residues and carbohydrates are shown in a ball-and-stick representation (see Fig. 3). (B) The molecular surfaces of the β-sandwich scaffolds are shown beneath ribbon representations of the variable regions. The view is appoximately from the top of the structure as seen in panel A. Residues on the surfaces of the scaffolds that are identical between FeB-RBD and Fr-RBD are colored blue, and nonidentical positions are white. Cysteine residues in the variable regions are shown in a ball-and-stick representation. Carbohydrates are not shown. (C) The view of the structures rotated 90° around the x axis from their orientations in panel B.
FIG. 3.
FIG. 3.
Sequence alignment of FeB-RBD (top) (18) with Fr-RBD (bottom) (19). To correspond to the color scheme in Fig. 2, the sequence of the VRA region is displayed astride a red bar, VRB is indicated by a yellow bar, and the β-scaffold is indicated by a blue bar. The sequences of regions with structurally superposable polypeptide backbones are juxtaposed more closely, whereas the sequences from regions that are structurally distinct are separated. Sequences that form β-strands in the conserved scaffolds are indicated by arrows above the FeB-RBD sequence and below the Fr-RBD sequence. Springs represent α-helices. Thin, double-headed arrows point to the four positions in each RBD variable region that are occupied by the same amino acid in the two viruses and have structurally conserved roles. N-linked glycosylation sites are illustrated by forks (Ψ). Some FeB-RBD amino acid residues are numbered as reference points. Residues at the termini that cannot be modeled are shown in gray.
FIG. 4.
FIG. 4.
Surface contours and charge density of FeB-RBD (left panels) compared to Fr-RBD (right panels). In the top panels, the RBDs are viewed in the same orientation as in Fig. 2B. The structures were then rotated 90° around the x axis to obtain the view in the bottom panels, which corresponds to Fig. 2C. Regions of basic potential (>10.6 kBT/e for FeB-RBD, >9.5 kBT/e for Fr-RBD) are in blue; acidic regions (<−9.8 kBT/e for FeB-RBD, −11.2 kBT/e for Fr-RBD) are in red. Some surface-exposed amino acids in the variable subdomains are labeled. The figure was generated by using GRASP (35).
FIG. 5.
FIG. 5.
VRA helix and the interface between the receptor-binding surface and the conserved interaction with the β-scaffold. (A) A 2Fo-Fc electron density map calculated with CNS (9) is displayed at 1.2σ around the final model of FeB-RBD. Dotted lines indicate interactions between the guanidino group of Arg70 and backbone carbonyl groups in the vicinity. Unmodeled electron density toward the upper left corresponds to the region containing Pro68 and Phe59 in a symmetry-related molecule. (B) Schematic diagram of the interactions made by the four consensus residues, Trp51, Cys64, Arg70, and Cys142, at the interface between the variable subdomain and the conserved scaffold of FeB-RBD. The view is from the top of panel A. Interactions are shown in projection and are not to scale. Red balls represent backbone carbonyl oxygen atoms, yellow balls are cysteine sulfur atoms, blue balls are side chain nitrogen atoms, and green balls are side chain carbon atoms. Although the side chains of the Arg70 residue in each of the two molecules of the asymmetric unit of FeB-RBD superpose, they make slightly different contacts with adjacent residues. It is not clear whether these differences reflect real alternatives or limitations of the diffraction data. The composite of all interactions is shown in this figure. The corresponding residues in Fr-RBD are marked in Fig. 3.
FIG. 5.
FIG. 5.
VRA helix and the interface between the receptor-binding surface and the conserved interaction with the β-scaffold. (A) A 2Fo-Fc electron density map calculated with CNS (9) is displayed at 1.2σ around the final model of FeB-RBD. Dotted lines indicate interactions between the guanidino group of Arg70 and backbone carbonyl groups in the vicinity. Unmodeled electron density toward the upper left corresponds to the region containing Pro68 and Phe59 in a symmetry-related molecule. (B) Schematic diagram of the interactions made by the four consensus residues, Trp51, Cys64, Arg70, and Cys142, at the interface between the variable subdomain and the conserved scaffold of FeB-RBD. The view is from the top of panel A. Interactions are shown in projection and are not to scale. Red balls represent backbone carbonyl oxygen atoms, yellow balls are cysteine sulfur atoms, blue balls are side chain nitrogen atoms, and green balls are side chain carbon atoms. Although the side chains of the Arg70 residue in each of the two molecules of the asymmetric unit of FeB-RBD superpose, they make slightly different contacts with adjacent residues. It is not clear whether these differences reflect real alternatives or limitations of the diffraction data. The composite of all interactions is shown in this figure. The corresponding residues in Fr-RBD are marked in Fig. 3.
FIG. 6.
FIG. 6.
FeLV-T infection is not strictly dependent on FeLIX. (Top) Feline FeF cells were exposed to serial dilutions of a retroviral vector derived from FeLV-T provirus, EECC(Ψ−) (10), and encoding Escherichia coli β-galactosidase. A specified concentration of purified FeB-RBD (0.04 to 1,000 nM) was added to the medium of each plate. After 4 h, medium containing virus and RBD was replaced with fresh medium. After an additional 48 h, cells expressing β-galactosidase were counted, and the virus titer (in international units/milliliter) was calculated by endpoint dilution. The data are the means ± 1 standard error of three independent experiments. (Bottom) FeLV-T infection was measured as a function of Fr-RBD concentration (0.01 to 1,000 nM) of FeF cells and FeF cells that stably express the Fr-RBD receptor, mCAT1, by using the protocol described for panel A.
FIG. 7.
FIG. 7.
Virus and host requirements for FeLV-T infection. (A) FeB-RBD-activated FeLV-T infection is dependent on the Pit1 receptor. CHTG or CHTG-Pit1 cells that stably express human Pit1 receptor were exposed to serial dilutions of a retroviral vector derived from FeLV-T provirus, EECC(Ψ−), and encoding E. coli β-galactosidase. A specified concentration of purified FeB-RBD (0.01 to 1,000 nM) was added to the medium of each plate. After 4 h, medium containing virus and RBD was replaced with fresh medium. After an additional 48 h, cells expressing β-galactosidase were counted, and the virus titer (in international units/milliliter) was calculated by endpoint dilution. The data are the means ± 1 standard error of three independent experiments. (B) The presence of FeLV-T RBD is not required for FeB-RBD-dependent transactivation. The infectious titers of FeLV-T and FeLV-T (ΔRBD) in which RBD has been deleted from the virus envelope glycoprotein were measured as a function of FeB-RBD concentration on CHTG-Pit1 cells as described above. (C) The effect of FeB-RBD concentration on Fr-RBD-dependent FeLV-T infection of CHTG-mCAT1 cells stably expressing the Fr-RBD receptor, mCAT1, was measured. In each example, cells were exposed to virus and Fr-RBD (40 nM) and the indicated concentration of FeB-RBD (left and center panels, 0.04 to 1,000 nM) or FeB-RBD (ΔHis5) in which the His5 residue was deleted (right panel, 0.04 to 4,000 nM). Under these conditions, the infectious titers of FeLV-T (left panel), FeLV-T (ΔRBD) (center panel), and FeLV-T (right panel) were measured as in panels A and B.
FIG. 8.
FIG. 8.
Transactivation is sufficient for FeLV-T replication and pathogenesis. Human 293-mCAT1 cells were exposed to either FeLV-T or FeLV-T in which RBD had been deleted from the virus envelope glycoprotein (FeLV-T [ΔRBD]) and cultured in the continuous presence of Fr-RBD in the medium (20 nM). Cells were passaged every 3 or 4 days, and Fr-RBD was replaced. Cells were inspected for virus-induced cell-cell fusion, and the experiment was stopped when >95% of cells were present in large syncytia that did not survive passage (day 21 for FeLV-T and day 28 for FeLV-T [ΔRBD]). At intervals after initial infection, cell DNA was prepared and used as a template for quantitative PCR measurement of acquired FeLV-T proviruses by using specific primers derived from the FeLV-T gag gene. These measurements were calibrated against a standard curve obtained by spiking 293mCAT1 cell DNA with a linear plasmid containing the FeLV-T provirus plasmid, EECC, at calculated concentrations of 0.01, 0.1, 1, 10, and 100 copies/haploid genome. The number of FeLV-T proviruses per 293mCAT1 cell haploid genome is shown (average of triplicate measurements from a single experiment) as a function of number of days after initial exposure to FeLV-T. The lower limit of FeLV-T provirus detection is 0.01 copy per haploid genome.

Similar articles

Cited by

References

    1. Albritton, L. M., L. Tseng, D. Scadden, and J. M. Cunningham. 1989. A putative murine ecotropic retrovirus receptor gene encodes a multiple membrane-spanning protein and confers susceptibility to virus infection. Cell 57:659-666. - PubMed
    1. Anderson, M. M., A. S. Lauring, C. C. Burns, and J. Overbaugh. 2000. Identification of a cellular cofactor required for infection by feline leukemia virus. Science 287:1828-1830. - PubMed
    1. Bae, Y., S. M. Kingsman, and A. J. Kingsman. 1997. Functional dissection of the Moloney murine leukemia virus envelope protein gp70. J. Virol. 71:2092-2099. - PMC - PubMed
    1. Barnett, A. L., and J. M. Cunningham. 2001. Receptor binding transforms the surface subunit of the mammalian C-type retrovirus envelope protein from an inhibitor to an activator of fusion. J. Virol. 75:9096-9105. - PMC - PubMed
    1. Barnett, A. L., R. A. Davey, and J. M. Cunningham. 2001. Modular organization of the Friend murine leukemia virus envelope protein underlies the mechanism of infection. Proc. Natl. Acad. Sci. USA 98:4113-4118. - PMC - PubMed

Publication types

Substances

Associated data

LinkOut - more resources