

doi: 10.1128/jvi.77.4.2762-2767.2003.
Human immunodeficiency virus type 1 attachment, coreceptor, and fusion inhibitors are active against both direct and trans infection of primary cells
Affiliations
- PMID: 12552019
- PMCID: PMC141110
- DOI: 10.1128/jvi.77.4.2762-2767.2003
Item in Clipboard
Human immunodeficiency virus type 1 attachment, coreceptor, and fusion inhibitors are active against both direct and trans infection of primary cells
J Virol.
2003 Feb.
Abstract
Inhibitors of human immunodeficiency virus type 1 attachment (CD4-immunoglobulin G subclass 2), CCR5 usage (PRO 140), and fusion (T-20) were tested on diverse primary cell types that represent the major targets both for infection in vivo and for the inhibition of trans infection of target cells by virus bound to dendritic cells. Although minor cell-type-dependent differences in potency were observed, each inhibitor was active on each cell type and trans infection was similarly vulnerable to inhibition at each stage of the fusion cascade.
Figures

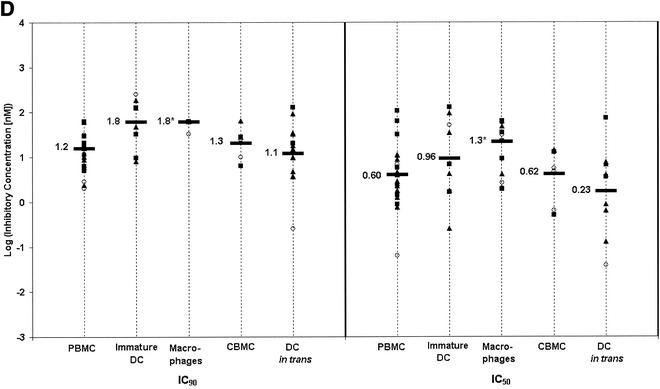
Cell-type-specific variations in inhibitor activity. IC50s and IC90s were observed for CD4-IgG2 (A), PRO 140 (B), T-20 (C), and RANTES (D) against HIV-1JR-FL (open circles), HIV-1SF162 (filled squares), and HIV-1Case C 1/85 (filled triangles) on the indicated cell types. Overall mean log IC50s and IC90s for all assays are indicated with horizontal bars. Mean log ICs that differed significantly (P < 0.013) from the corresponding value for PBMC are indicated with an asterisk. (A) CD4-IgG2. The mean log IC90s and IC50s obtained for macrophages were significantly lower than those obtained for PBMC (P = 7.9 × 10⁻⁷ for both IC90 and IC50). Mean log ICs for CBMC were also lower than those for PBMC (P = 0.0039 and 0.0045 for IC90 and IC50, respectively). None of the other values were significantly different from those for PBMC. (For IC90s, P = 0.96 for immature DC and 0.78 for DC in trans. For IC50s, P = 0.91 for immature DC and 0.82 for DC in trans.) (B) PRO 140. The mean log IC90 for immature DC was significantly higher than that for PBMC (P = 5.7 × 10⁻⁴). None of the other mean log IC90s were different from those for PBMC (P = 0.63 for macrophages, 0.19 for CBMC, and 0.38 for DC in trans). None of the IC50s differed from that for PBMC (P = 0.33 for immature DC, 0.23 for macrophages, 0.94 for CBMC, and 0.89 for DC in trans). (C) T-20. Immature DC had an IC90 higher than that for PBMC (P = 8.8 × 10⁻⁴). No other cell types had IC90s different from those for PBMC (P = 0.47 for macrophages, 0.62 for CBMC, and 0.19 for DC in trans). No IC50s were different compared to those for PBMC (P = 0.17 for immature DC, 0.34 for macrophages, 0.32 for CBMC, and 0.76 for DC in trans). (D) RANTES. Macrophages had higher mean log ICs than did PBMC (P = 4.8 × 10⁻⁷ for IC90 and 2.9 × 10⁻⁴ for IC50). The IC90s for immature DC bordered on being significantly higher than those for PBMC (P = 0.013). No other cell types had ICs different from those for PBMC. (For IC90s, P = 0.43 for CBMC and 0.63 for DC in trans. For IC50s, P = 0.31 for immature DC, 0.96 for CBMC, and 0.21 for DC in trans.) Any higher ICs for immature DC may reflect the 10-fold greater virus doses used to detect production infection in these assays.

Cell-type-specific variations in inhibitor activity. IC50s and IC90s were observed for CD4-IgG2 (A), PRO 140 (B), T-20 (C), and RANTES (D) against HIV-1JR-FL (open circles), HIV-1SF162 (filled squares), and HIV-1Case C 1/85 (filled triangles) on the indicated cell types. Overall mean log IC50s and IC90s for all assays are indicated with horizontal bars. Mean log ICs that differed significantly (P < 0.013) from the corresponding value for PBMC are indicated with an asterisk. (A) CD4-IgG2. The mean log IC90s and IC50s obtained for macrophages were significantly lower than those obtained for PBMC (P = 7.9 × 10⁻⁷ for both IC90 and IC50). Mean log ICs for CBMC were also lower than those for PBMC (P = 0.0039 and 0.0045 for IC90 and IC50, respectively). None of the other values were significantly different from those for PBMC. (For IC90s, P = 0.96 for immature DC and 0.78 for DC in trans. For IC50s, P = 0.91 for immature DC and 0.82 for DC in trans.) (B) PRO 140. The mean log IC90 for immature DC was significantly higher than that for PBMC (P = 5.7 × 10⁻⁴). None of the other mean log IC90s were different from those for PBMC (P = 0.63 for macrophages, 0.19 for CBMC, and 0.38 for DC in trans). None of the IC50s differed from that for PBMC (P = 0.33 for immature DC, 0.23 for macrophages, 0.94 for CBMC, and 0.89 for DC in trans). (C) T-20. Immature DC had an IC90 higher than that for PBMC (P = 8.8 × 10⁻⁴). No other cell types had IC90s different from those for PBMC (P = 0.47 for macrophages, 0.62 for CBMC, and 0.19 for DC in trans). No IC50s were different compared to those for PBMC (P = 0.17 for immature DC, 0.34 for macrophages, 0.32 for CBMC, and 0.76 for DC in trans). (D) RANTES. Macrophages had higher mean log ICs than did PBMC (P = 4.8 × 10⁻⁷ for IC90 and 2.9 × 10⁻⁴ for IC50). The IC90s for immature DC bordered on being significantly higher than those for PBMC (P = 0.013). No other cell types had ICs different from those for PBMC. (For IC90s, P = 0.43 for CBMC and 0.63 for DC in trans. For IC50s, P = 0.31 for immature DC, 0.96 for CBMC, and 0.21 for DC in trans.) Any higher ICs for immature DC may reflect the 10-fold greater virus doses used to detect production infection in these assays.

Cell-type-specific variations in inhibitor activity. IC50s and IC90s were observed for CD4-IgG2 (A), PRO 140 (B), T-20 (C), and RANTES (D) against HIV-1JR-FL (open circles), HIV-1SF162 (filled squares), and HIV-1Case C 1/85 (filled triangles) on the indicated cell types. Overall mean log IC50s and IC90s for all assays are indicated with horizontal bars. Mean log ICs that differed significantly (P < 0.013) from the corresponding value for PBMC are indicated with an asterisk. (A) CD4-IgG2. The mean log IC90s and IC50s obtained for macrophages were significantly lower than those obtained for PBMC (P = 7.9 × 10⁻⁷ for both IC90 and IC50). Mean log ICs for CBMC were also lower than those for PBMC (P = 0.0039 and 0.0045 for IC90 and IC50, respectively). None of the other values were significantly different from those for PBMC. (For IC90s, P = 0.96 for immature DC and 0.78 for DC in trans. For IC50s, P = 0.91 for immature DC and 0.82 for DC in trans.) (B) PRO 140. The mean log IC90 for immature DC was significantly higher than that for PBMC (P = 5.7 × 10⁻⁴). None of the other mean log IC90s were different from those for PBMC (P = 0.63 for macrophages, 0.19 for CBMC, and 0.38 for DC in trans). None of the IC50s differed from that for PBMC (P = 0.33 for immature DC, 0.23 for macrophages, 0.94 for CBMC, and 0.89 for DC in trans). (C) T-20. Immature DC had an IC90 higher than that for PBMC (P = 8.8 × 10⁻⁴). No other cell types had IC90s different from those for PBMC (P = 0.47 for macrophages, 0.62 for CBMC, and 0.19 for DC in trans). No IC50s were different compared to those for PBMC (P = 0.17 for immature DC, 0.34 for macrophages, 0.32 for CBMC, and 0.76 for DC in trans). (D) RANTES. Macrophages had higher mean log ICs than did PBMC (P = 4.8 × 10⁻⁷ for IC90 and 2.9 × 10⁻⁴ for IC50). The IC90s for immature DC bordered on being significantly higher than those for PBMC (P = 0.013). No other cell types had ICs different from those for PBMC. (For IC90s, P = 0.43 for CBMC and 0.63 for DC in trans. For IC50s, P = 0.31 for immature DC, 0.96 for CBMC, and 0.21 for DC in trans.) Any higher ICs for immature DC may reflect the 10-fold greater virus doses used to detect production infection in these assays.
Cell-type-specific variations in inhibitor activity. IC50s and IC90s were observed for CD4-IgG2 (A), PRO 140 (B), T-20 (C), and RANTES (D) against HIV-1JR-FL (open circles), HIV-1SF162 (filled squares), and HIV-1Case C 1/85 (filled triangles) on the indicated cell types. Overall mean log IC50s and IC90s for all assays are indicated with horizontal bars. Mean log ICs that differed significantly (P < 0.013) from the corresponding value for PBMC are indicated with an asterisk. (A) CD4-IgG2. The mean log IC90s and IC50s obtained for macrophages were significantly lower than those obtained for PBMC (P = 7.9 × 10⁻⁷ for both IC90 and IC50). Mean log ICs for CBMC were also lower than those for PBMC (P = 0.0039 and 0.0045 for IC90 and IC50, respectively). None of the other values were significantly different from those for PBMC. (For IC90s, P = 0.96 for immature DC and 0.78 for DC in trans. For IC50s, P = 0.91 for immature DC and 0.82 for DC in trans.) (B) PRO 140. The mean log IC90 for immature DC was significantly higher than that for PBMC (P = 5.7 × 10⁻⁴). None of the other mean log IC90s were different from those for PBMC (P = 0.63 for macrophages, 0.19 for CBMC, and 0.38 for DC in trans). None of the IC50s differed from that for PBMC (P = 0.33 for immature DC, 0.23 for macrophages, 0.94 for CBMC, and 0.89 for DC in trans). (C) T-20. Immature DC had an IC90 higher than that for PBMC (P = 8.8 × 10⁻⁴). No other cell types had IC90s different from those for PBMC (P = 0.47 for macrophages, 0.62 for CBMC, and 0.19 for DC in trans). No IC50s were different compared to those for PBMC (P = 0.17 for immature DC, 0.34 for macrophages, 0.32 for CBMC, and 0.76 for DC in trans). (D) RANTES. Macrophages had higher mean log ICs than did PBMC (P = 4.8 × 10⁻⁷ for IC90 and 2.9 × 10⁻⁴ for IC50). The IC90s for immature DC bordered on being significantly higher than those for PBMC (P = 0.013). No other cell types had ICs different from those for PBMC. (For IC90s, P = 0.43 for CBMC and 0.63 for DC in trans. For IC50s, P = 0.31 for immature DC, 0.96 for CBMC, and 0.21 for DC in trans.) Any higher ICs for immature DC may reflect the 10-fold greater virus doses used to detect production infection in these assays.
Similar articles
-
Entry inhibitors SCH-C, RANTES, and T-20 block HIV type 1 replication in multiple cell types.AIDS Res Hum Retroviruses. 2003 Mar;19(3):177-86. doi: 10.1089/088922203763315678. AIDS Res Hum Retroviruses. 2003. PMID: 12689409
-
HIV fusion and its inhibition.Antiviral Res. 2001 May;50(2):95-115. doi: 10.1016/s0166-3542(01)00130-9. Antiviral Res. 2001. PMID: 11369431 Review. No abstract available.
-
Sensitivity of human immunodeficiency virus type 1 to the fusion inhibitor T-20 is modulated by coreceptor specificity defined by the V3 loop of gp120.J Virol. 2000 Sep;74(18):8358-67. doi: 10.1128/jvi.74.18.8358-8367.2000. J Virol. 2000. PMID: 10954535 Free PMC article.
-
Human immunodeficiency virus type 1 entry inhibitors PRO 542 and T-20 are potently synergistic in blocking virus-cell and cell-cell fusion.J Infect Dis. 2001 Apr 1;183(7):1121-5. doi: 10.1086/319284. Epub 2001 Mar 8. J Infect Dis. 2001. PMID: 11237840
-
Resistance to HIV-1 entry inhibitors.Curr Drug Targets Infect Disord. 2003 Dec;3(4):283-94. doi: 10.2174/1568005033481015. Curr Drug Targets Infect Disord. 2003. PMID: 14754430 Review.
Cited by
-
Determinants of human immunodeficiency virus type 1 baseline susceptibility to the fusion inhibitors enfuvirtide and T-649 reside outside the peptide interaction site.J Virol. 2004 Jul;78(14):7582-9. doi: 10.1128/JVI.78.14.7582-7589.2004. J Virol. 2004. PMID: 15220433 Free PMC article.
-
Opportunities for therapeutic antibodies directed at G-protein-coupled receptors.Nat Rev Drug Discov. 2017 Sep;16(9):787-810. doi: 10.1038/nrd.2017.91. Epub 2017 Jul 14. Nat Rev Drug Discov. 2017. PMID: 28706220 Review.
-
A fusion inhibitor prevents spread of immunodeficiency viruses, but not activation of virus-specific T cells, by dendritic cells.J Virol. 2008 Jun;82(11):5329-39. doi: 10.1128/JVI.01987-07. Epub 2008 Mar 26. J Virol. 2008. PMID: 18367527 Free PMC article.
-
CCR5 monoclonal antibodies for HIV-1 therapy.Curr Opin HIV AIDS. 2009 Mar;4(2):104-11. doi: 10.1097/COH.0b013e3283224015. Curr Opin HIV AIDS. 2009. PMID: 19339948 Free PMC article. Review.
-
Preclinical evaluation of the HIV-1 fusion inhibitor L'644 as a potential candidate microbicide.Antimicrob Agents Chemother. 2012 May;56(5):2347-56. doi: 10.1128/AAC.06108-11. Epub 2012 Feb 13. Antimicrob Agents Chemother. 2012. PMID: 22330930 Free PMC article.
References
-
- Allaway, G. P., K. L. Davis-Bruno, G. A. Beaudry, E. B. Garcia, E. L. Wong, A. M. Ryder, K. W. Hasel, M.-C. Gauduin, R. A. Koup, J. S. McDougal, and P. J. Maddon. 1995. Expression and characterization of CD4-IgG2, a novel heterotetramer which neutralizes primary HIV-1 isolates. AIDS Res. Hum. Retrovir. 11:533-539. - PubMed
-
- Amzazi, S., L. Ylisastigui, Y. Bakri, L. Rabehi, L. Gattegno, M. Parmentier, J. C. Gluckman, and A. Benjouad. 1998. The inhibitory effect of RANTES on the infection of primary macrophages by R5 human immunodeficiency virus type-1 depends on the macrophage activation state. Virology 252:96-105. - PubMed
-
- Arenzana-Seisdedos, F., J. L. Virelizier, D. Rousset, I. Clark-Lewis, P. Loetscher, B. Moser, and M. Baggiolini. 1996. HIV blocked by chemokine antagonist. Nature 383:400.. - PubMed
-
- Berger, E. A., P. M. Murphy, and J. M. Farber. 1999. Chemokine receptors as HIV-1 coreceptors: roles in viral entry, tropism, and disease. Annu. Rev. Immunol. 17:657-700. - PubMed
-
- Chan, D. C., and P. S. Kim. 1998. HIV entry and its inhibition. Cell 93:681-684. - PubMed
Publication types
MeSH terms
Substances
Grants and funding
LinkOut - more resources
Full Text Sources
Other Literature Sources
Medical
Research Materials
