. 2003 Feb;77(4):2775-8.
doi: 10.1128/jvi.77.4.2775-2778.2003.

Kinetics of virus-specific CD8+ -T-cell expansion and trafficking following central nervous system infection

Affiliations

Kinetics of virus-specific CD8+ -T-cell expansion and trafficking following central nervous system infection

Norman W Marten et al. J Virol. 2003 Feb.

Abstract

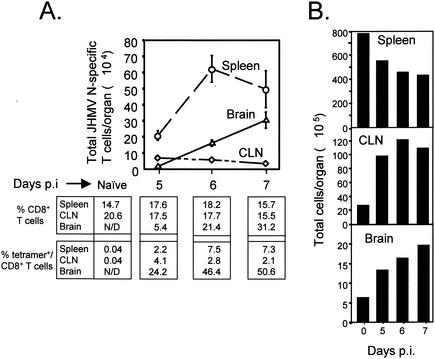
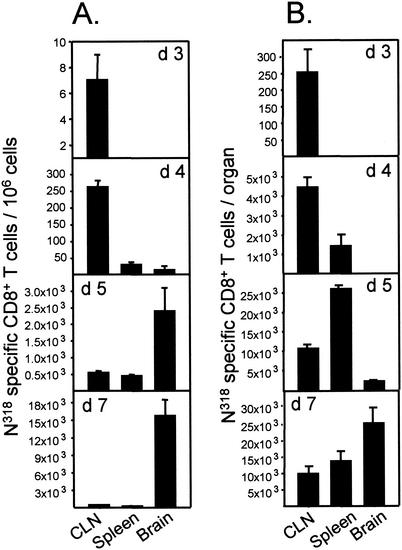
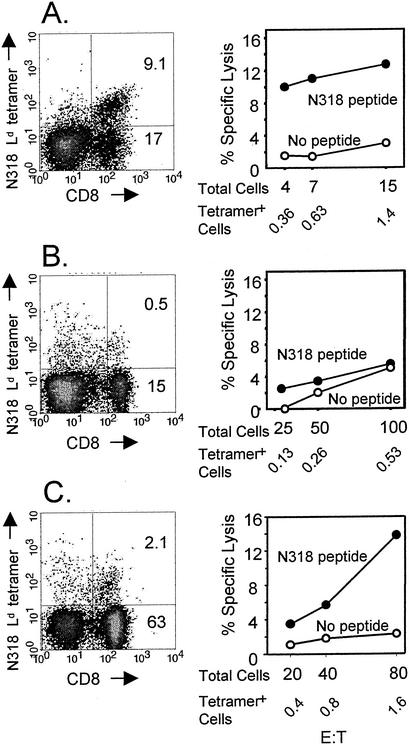
CD8+ T cells control acute infection of the central nervous system (CNS) by neurotropic mouse hepatitis virus but do not suffice to achieve sterile immunity. To determine the lag between T-cell priming and optimal activity within the CNS, the accumulation of virus-specific CD8+ T cells in the CNS relative to that in peripheral lymphoid organs was assessed by using gamma interferon-specific ELISPOT assays and class I tetramer staining. Virus-specific CD8+ T cells were first detected in the cervical lymph nodes. Expansion in the spleen was delayed and less pronounced but also preceded accumulation in the CNS. The data further suggest peripheral acquisition of cytolytic function, thus enhancing CD8+ -T-cell effector function upon cognate antigen recognition in the CNS.


Figures

FIG. 1.
FIG. 1.
Distribution of virus-specific, tetramer-positive CD8+ T cells. Mononuclear cells prepared from brain, CLN, and spleen of JHMV-infected mice on days 5, 6, and 7 p.i. (n = 3 per time point) were stained with the Ld-N318 tetramer and anti-CD8 monoclonal antibody and analyzed by flow cytometry. (A) Total numbers of virus-specific CD8+ T cells were calculated by multiplying the frequency of tetramer-positive CD8+ T cells within each sample by the number of cells recovered from each organ. Error bars represent the standard error of the average number of total virus-specific CD8+ T cells recovered from each organ. Percentages of CD8+ T cells and of tetramer-positive CD8+ T cells are indicated for each organ. (B) Total numbers of cells recovered per organ. Representative data from one of two experiments are shown.
FIG. 2.
FIG. 2.
Frequencies and relative accumulation of IFN-γ-secreting virus-specific CD8+ T cells during CNS infection. Cells isolated from brain, spleen, and CLN of JHMV-infected mice (n = 3) at the indicated time points (d, day) were pooled, and serial dilutions were plated in triplicate beginning at 106 cells/well. IFN-γ ELISPOT assays were carried out as described previously (2, 17) by using N318 peptide-coated syngeneic splenocytes (1 μM) as stimulators. (A) Frequencies are presented as the number of IFN-γ-producing cells per 106 input cells. Error bars represent the standard errors of results for six wells counted per sample. Background spots accounted for less than 12.5% of the number of spots counted in the presence of peptide. (B) Total number of virus-specific CD8+ T cells per organ as determined from frequencies depicted in panel A.
FIG. 3.
FIG. 3.
Cytolysis of CD8+ T cells isolated from the CNS and spleen during acute JHMV infection. Brain-derived cells (A), unfractionated splenocytes (B), and splenocytes depleted of B cells, adherent macrophages, and CD4+ T cells (C) were prepared from mice at 7 days p.i. (n = 6). Cells were stained with anti-CD8 monoclonal antibody and the Ld-N318 tetramer (left panels) and directly assayed ex vivo for lysis of BC10ME target cells in the presence or absence of 100 nM N318 peptide (right panels). Percentages of tetramer-positive and tetramer-negative CD8+ T cells are indicated in the upper right and lower right quadrants of each plot, respectively. E:T ratios are based on total numbers of effector cells or tetramer-positive CD8+ cells as indicated. Background release was less then 10% of the maximal release.

Similar articles

Cited by

References

    1. Bergmann, C. C., C. Ramakrishna, M. Kornacki, and S. A. Stohlman. 2001. Impaired T cell immunity in B cell-deficient mice following central nervous system infection. J. Immunol. 167:1575-1583. - PubMed
    1. Bergmann, C. C., J. D. Altman, D. Hinton, and S. A. Stohlman. 1999. Inverted immunodominance and impaired cytolytic function of CD8+ T cells during viral persistence in the central nervous system. J. Immunol. 163:3379-3387. - PubMed
    1. Bergmann, C. C., M. McMillan, and S. A. Stohlman. 1993. Characterization of the Ld-restricted cytotoxic T-lymphocyte epitope in the mouse hepatitis virus nucleocapsid protein. J. Virol. 67:7041-7049. - PMC - PubMed
    1. Castro, R. F., and S. Perlman. 1996. Differential antigen recognition by T cells from the spleen and central nervous system of coronavirus-infected mice. Virology 222:247-251. - PMC - PubMed
    1. Coles, N. M., S. N. Mueller, W. R. Heath, F. R. Carbone, and A. G. Brooks. 2002. Progression of armed CTL from draining lymph node to spleen shortly after localized infection with HSV-1. J. Immunol. 168:834-838. - PubMed

Publication types

MeSH terms

Substances