Comparative Study
. 2003 Feb 4;100(3):1140-5.
doi: 10.1073/pnas.0337561100. Epub 2003 Jan 27.

Comparison of mouse and human genomes followed by experimental verification yields an estimated 1,019 additional genes

Affiliations
Comparative Study

Comparison of mouse and human genomes followed by experimental verification yields an estimated 1,019 additional genes

Roderic Guigo et al. Proc Natl Acad Sci U S A. .

Abstract

A primary motivation for sequencing the mouse genome was to accelerate the discovery of mammalian genes by using sequence conservation between mouse and human to identify coding exons. Achieving this goal proved challenging because of the large proportion of the mouse and human genomes that is apparently conserved but apparently does not code for protein. We developed a two-stage procedure that exploits the mouse and human genome sequences to produce a set of genes with a much higher rate of experimental verification than previously reported prediction methods. RT-PCR amplification and direct sequencing applied to an initial sample of mouse predictions that do not overlap previously known genes verified the regions flanking one intron in 139 predictions, with verification rates reaching 76%. On average, the confirmed predictions show more restricted expression patterns than the mouse orthologs of known human genes, and two-thirds lack homologs in fish genomes, demonstrating the sensitivity of this dual-genome approach to hard-to-find genes. We verified 112 previously unknown homologs of known proteins, including two homeobox proteins relevant to developmental biology, an aquaporin, and a homolog of dystrophin. We estimate that transcription and splicing can be verified for >1,000 gene predictions identified by this method that do not overlap known genes. This is likely to constitute a significant fraction of the previously unknown, multiexon mammalian genes.


Figures

Figure 1
Figure 1
An example of predictions with aligned introns. RT-PCR positive predicted protein 3B1 (a novel homolog of Dystrophin) is aligned with its predicted human ortholog (N-terminal regions shown; Upper of each row: mouse, Lower of each row: human). Each color indicates one coding exon. Three of four predicted splice boundaries (color boundaries) align perfectly. Any one of these three is sufficient for surviving the enrichment step. Gaps in the alignment (shown as dashes) may indicate mispredicted regions.
Figure 2
Figure 2
Two examples of predicted gene structures (blue) with introns verified by RT-PCR from primers located in exons flanking the introns indicated in red. Mouse–human genomic alignments (orange) correlate with predicted exons but do not match them exactly. (A) Verified mouse prediction 6F5, a novel homolog of Drosophila brain-specific homeobox protein (bsh), with matching human prediction. (B) Verified mouse prediction 11F6, a homolog of rat vanilloid receptor type 1-like protein 1. No matching human gene was predicted. A cDNA (GenBank accession no. AF510316) that matches the predicted protein over four protein-coding exons was deposited in GenBank subsequent to our analysis.
Figure 3
Figure 3
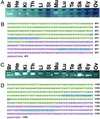
Verification of gene predictions by RT-PCR analysis. (A and B) Test of prediction 6F5, a homolog of Drosophila brain-specific homeobox protein (bsh). (C and D) Test of prediction 11F6, a homolog of rat vanilloid receptor type 1-like protein. Gel analysis of amplimers (*) with the source of the cDNA pool indicated above is shown in A and C. Primers (blue) and the region to which the amplimer sequence aligned (underlining) are shown in B and D. The indicated forward primers were used to generate the amplimer sequences (brain amplimer, B; skin amplimer, D). Br, brain; Ey, eye; He, heart; Ki, kidney; Li, liver; Lu, lung; Mu, muscle; Ov, ovary; Sk, skin; St, stomach; Te, testis; Th, thymus.
Figure 4
Figure 4
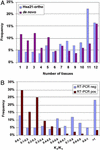
Characteristics of verified predictions. (A) Expression specificity. Percentages of RT-PCR positive de novo predictions (red) and Hsa21 mouse orthologs (blue) expressed in 1–12 tissues, tested in the same cDNA pools. (B) Distributions of the ratio of nonsynonymous to synonymous substitution rate (KA/KS) in 83 RT-PCR positive (red) vs. 98 RT-PCR negative (blue) mouse predictions with reciprocal best blast matches among the human predictions.

References

    1. Mouse Genome Sequencing Consortium. Nature. 2002;420:520–562. - PubMed
    1. Hubbard T, Barker D, Birney E, Cameron G, Chen Y, Clark L, Cox T, Cuff J, Curwen V, Down T, et al. Nucleic Acids Res. 2002;30:38–41. - PMC - PubMed
    1. Pruitt K D, Maglott D R. Nucleic Acids Res. 2001;29:137–140. - PMC - PubMed
    1. Kawai J, Shinagawa A, Shibata K, Yoshino M, Itoh M, Ishii Y, Arakawa T, Hara A, Fukunishi Y, Konno H, et al. Nature. 2001;409:685–690. - PubMed
    1. The FANTOM Consortium and The RIKEN Genome Exploration Research Group Phase II Team. Nature. 2002;420:563–571. - PubMed

Publication types