. 2003 Feb 4;100(3):1438-43.
doi: 10.1073/pnas.0237106100. Epub 2003 Jan 24.

Lower blood glucose, hyperglucagonemia, and pancreatic alpha cell hyperplasia in glucagon receptor knockout mice

Affiliations

Lower blood glucose, hyperglucagonemia, and pancreatic alpha cell hyperplasia in glucagon receptor knockout mice

R W Gelling et al. Proc Natl Acad Sci U S A. .

Abstract

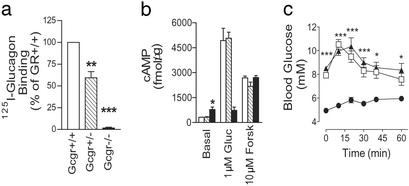
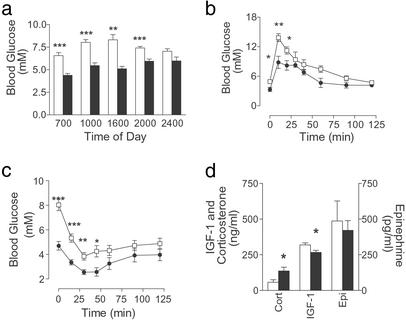
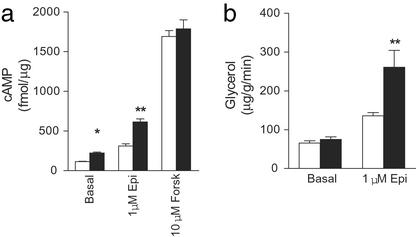
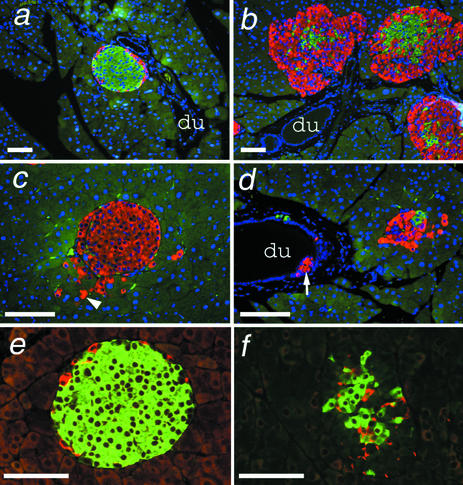
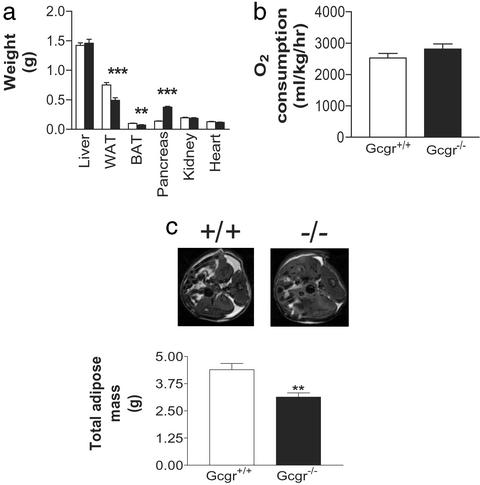
Glucagon, the counter-regulatory hormone to insulin, is secreted from pancreatic alpha cells in response to low blood glucose. To examine the role of glucagon in glucose homeostasis, mice were generated with a null mutation of the glucagon receptor (Gcgr(-/-)). These mice display lower blood glucose levels throughout the day and improved glucose tolerance but similar insulin levels compared with control animals. Gcgr(-/-) mice displayed supraphysiological glucagon levels associated with postnatal enlargement of the pancreas and hyperplasia of islets due predominantly to alpha cell, and to a lesser extent, delta cell proliferation. In addition, increased proglucagon expression and processing resulted in increased pancreatic glucogen-like peptide 1 (GLP-1) (1-37) and GLP-1 amide (1-36 amide) content and a 3- to 10-fold increase in circulating GLP-1 amide. Gcgr(-/-) mice also displayed reduced adiposity and leptin levels but normal body weight, food intake, and energy expenditure. These data indicate that glucagon is essential for maintenance of normal glycemia and postnatal regulation of islet and alpha and delta cell numbers. Furthermore, the lean phenotype of Gcgr(-/-) mice suggests glucagon action may be involved in the regulation of whole body composition.


Figures

Figure 1
Figure 1
Gcgr−/− mice lack functional glucagon receptors. [125I]Glucagon-binding (a) and glucagon-stimulated cAMP production (b) in liver membranes from male Gcgr+/+, Gcgr+/−, and Gcgr−/− mice. Control (open bars), Gcgr+/− (hatched bars), and Gcgr−/− (filled bars) mice are indicated. Gluc, glucagon; Forsk, forskolin. Data represent mean ± SEM (n = 3) from three independent preparations. (c) Intraperitoneal glucagon challenge of male Gcgr−/− (●), Gcgr+/− (▴), and Gcgr+/+ (□) mice. Data represent mean ± SEM, n = 5–7. *, P < 0.05; **, P < 0.01; ***, P < 0.001.
Figure 2
Figure 2
Glucose homeostasis in Gcgr−/− mice. (a) BG levels throughout the day for 10- to 12-wk-old control and Gcgr−/− male mice. Gcgr+/+, open bars; Gcgr−/−, filled bars (n = 5–7). IPGTT (b) (n = 4–7) and ITT (c) (n = 5–7) of 17- to 19-wk-old male mice. Gcgr+/+ mice (□) and Gcgr−/− mice (●) are indicated. (d) Fasted corticosterone (Cort) (n = 4), insulin-like growth factor-1 (n = 8), and epinephrine (Epi) (n = 8) serum levels in male Gcgr+/+ (open bars) and Gcgr−/− (filled bars) mice. All data are mean ± SEM. *, P < 0.05; **, P < 0.01; ***, P < 0.001.
Figure 3
Figure 3
Epinephrine-stimulated cAMP production in liver membranes and lipolysis in epididymal fat pads isolated from Gcgr+/+ and Gcgr−/− mice. (a) Epinephrine (Epi)- and forskolin (Forsk)-stimulated cAMP production in Gcgr+/+ (open bars) and Gcgr−/− (filled bars) mice. (b) Epinephrine-stimulated lipolysis as assessed by glycerol release. Data are representative of three experiments using three different membrane preparations. All data are the means ± SEM. *, P < 0.05; **, P < 0.01; ***, P < 0.001.
Figure 4
Figure 4
Gcgr−/− mice have islet and α cell hyperplasia. Photomicrographs of pancreatic sections from Gcgr+/+ (a and e) and Gcgr−/− (b–d and f) mice double immunostained for insulin (green) and glucagon (red), with nuclei visualized by Hoechst staining in blue (a–d) or insulin (green) and somatostatin (red) (e and f). du, ductal epithelium in a–c. In c, the arrowhead indicates single glucagon-positive cells within exocrine tissue adjacent to an islet. Arrowhead in d indicates an accumulation of glucagon-positive cells within the ductal epithelium. Pancreata were from female mice 8–9 wk of age (a and b) and 18 wk of age (c and d). Pancreata in e and f were from 18- to 20-wk-old male mice. Bars indicate 100 μm.
Figure 5
Figure 5
(a) Comparison of organ weights from 22- to 24-wk-old Gcgr+/+ and Gcgr−/− male mice (n = 5–14). Control (open bars) and Gcgr−/− (filled bars) mice are shown. WAT, perigonadal WAT; BAT, interscapular brown adipose tissue. (b) Indirect calorimetry measurements of O2 consumption. Resting VO2 values were determined for male mice 23–25 wk of age (n = 4). (c) MRI analysis of male Gcgr−/− mice. (Upper) Abdominal MRI images of Gcgr+/+ and Gcgr−/− mice. Adipose tissue appears white. (Lower) Comparison of total body adipose tissue (n = 5). All data are mean ± SEM. *, P < 0.05; **, P < 0.01; ***, P < 0.001.

Similar articles

Cited by

References

    1. Burcelin R, Katz E B, Charron M J. Diabetes Metab. 1996;22:373–396. - PubMed
    1. Lefèbvre P J. Diabetes Care. 1995;18:715–730. - PubMed
    1. Kieffer T J, Habener J F. Endocr Rev. 1999;20:876–913. - PubMed
    1. Porte D, Jr, Seeley R J, Woods S C, Baskin D G, Figlewicz D P, Schwartz M W. Diabetologia. 1998;41:863–881. - PubMed
    1. Holst J J. Regul Pept. 2000;93:45–51. - PubMed

Publication types

MeSH terms