

Global variation in terrestrial conservation costs, conservation benefits, and unmet conservation needs
- PMID: 12552123
- PMCID: PMC298723
- DOI: 10.1073/pnas.0236945100
Global variation in terrestrial conservation costs, conservation benefits, and unmet conservation needs
Abstract
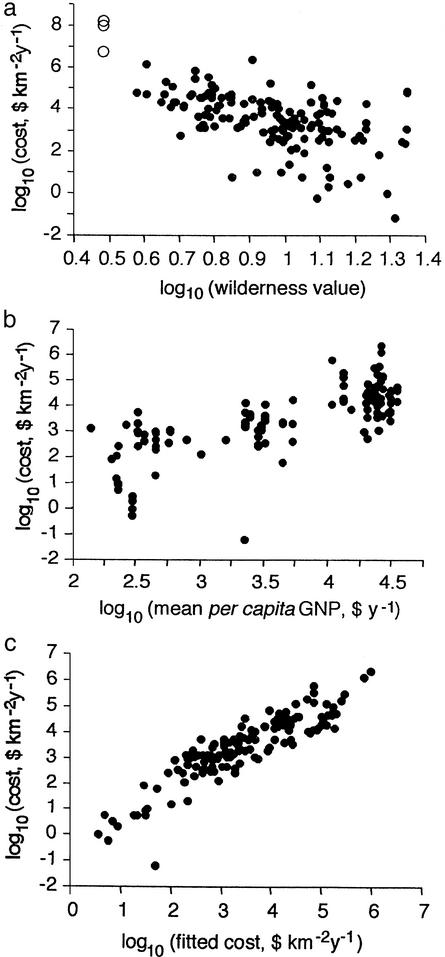
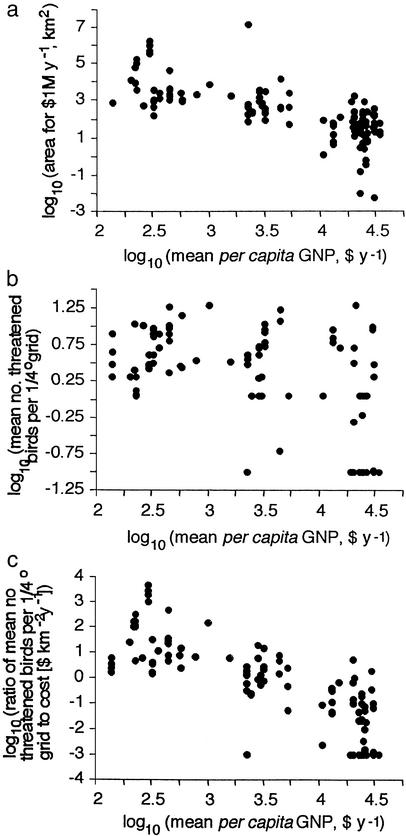
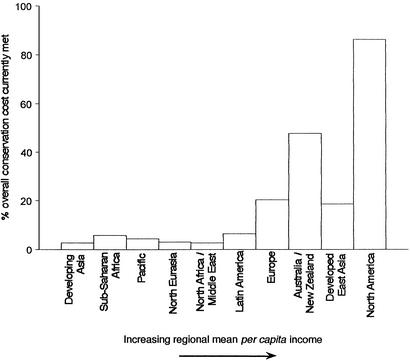
Our ability to identify cost-efficient priorities for conserving biological diversity is limited by the scarcity of data on conservation costs, particularly at fine scales. Here we address this issue using data for 139 terrestrial programs worldwide. We find that the annual costs of effective field-based conservation vary enormously, across seven orders of magnitude, from <$0.1 to >$1,000,000 per km(2). This variation can be closely predicted from positive associations between costs per unit area and an array of indices of local development. Corresponding measures of conservation benefit are limited but show opposing global trends, being higher in less developed parts of the world. The benefit-to-cost ratio of conservation is thus far greater in less developed regions, yet these are where the shortfall in current conservation spending is most marked. Substantially increased investment in tropical conservation is therefore urgently required if opportunities for cost-effective action are not to be missed.
Figures
References
-
- James A N, Gaston K J, Balmford A. Nature. 1999;401:323–324. - PubMed
-
- Margules C R, Pressey R L. Nature. 2000;405:243–253. - PubMed
-
- Ando A, Camm J, Polasky S, Solow A. Science. 1998;279:2126–2128. - PubMed
-
- Williams P H. In: Conservation in a Changing World. Mace G M, Balmford A, Ginsberg J R, editors. Cambridge, U.K.: Cambridge Univ. Press; 1998. pp. 211–249.
-
- Balmford A, Gaston K J, Rodrigues A S L, James A. Conserv Biol. 2000;14:597–605.
MeSH terms
LinkOut - more resources
Full Text Sources
