. 2003 Jan 28:4:5.
doi: 10.1186/1471-2105-4-5. Epub 2003 Jan 28.

Genomic data sampling and its effect on classification performance assessment

Affiliations

Genomic data sampling and its effect on classification performance assessment

Francisco Azuaje. BMC Bioinformatics. .

Abstract

Background: Supervised classification is fundamental in bioinformatics. Machine learning models, such as neural networks, have been applied to discover genes and expression patterns. This process is achieved by implementing training and test phases. In the training phase, a set of cases and their respective labels are used to build a classifier. During testing, the classifier is used to predict new cases. One approach to assessing its predictive quality is to estimate its accuracy during the test phase. Key limitations appear when dealing with small-data samples. This paper investigates the effect of data sampling techniques on the assessment of neural network classifiers.

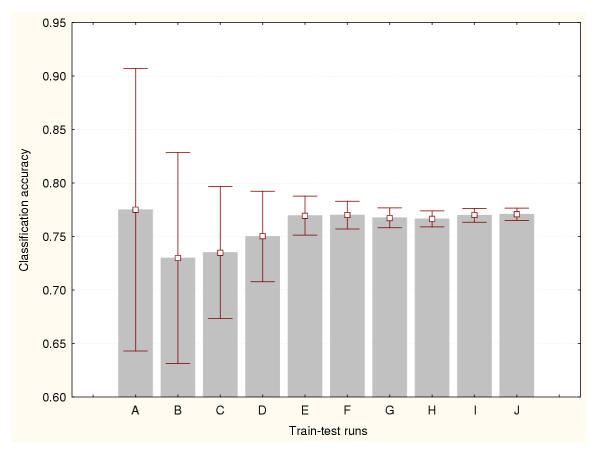
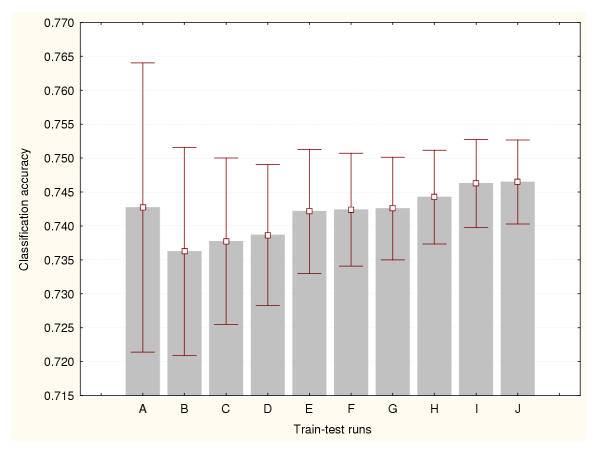
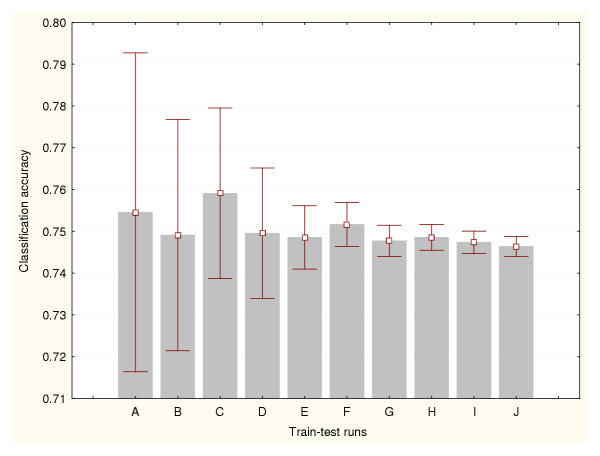
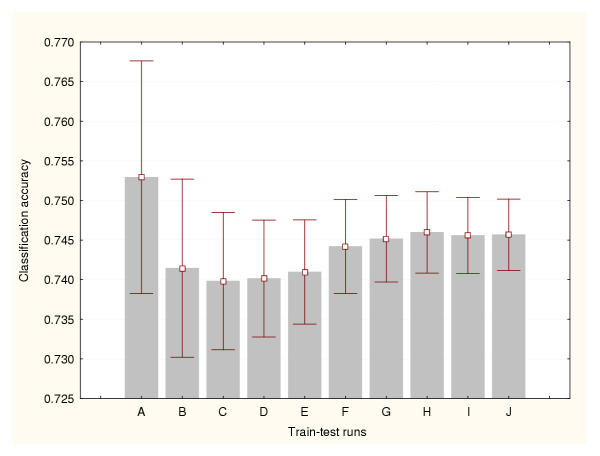
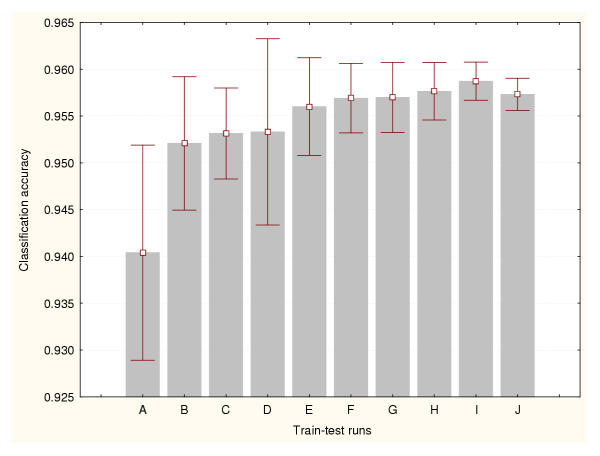
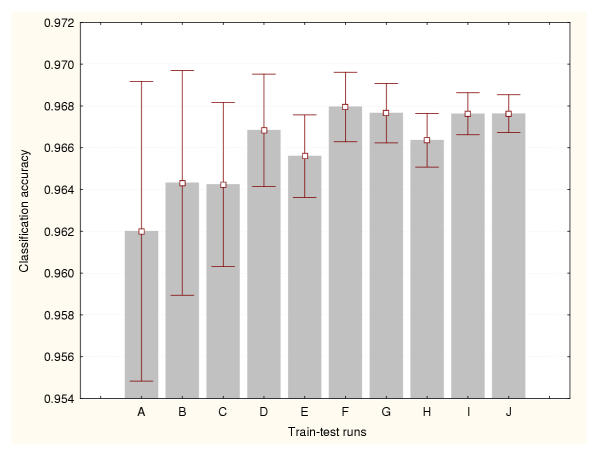
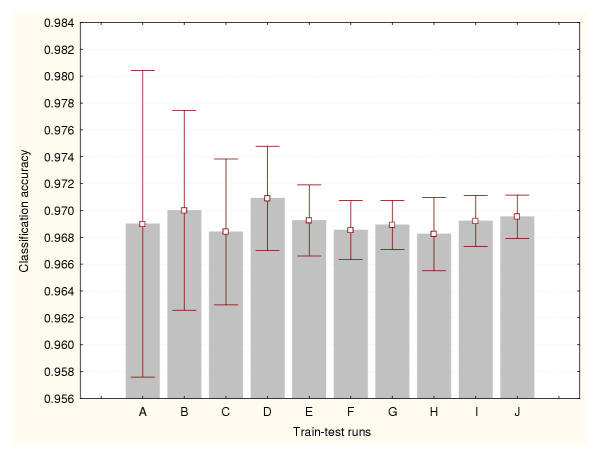
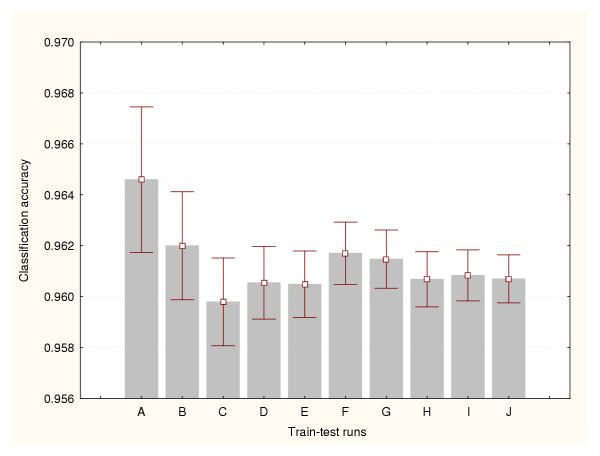
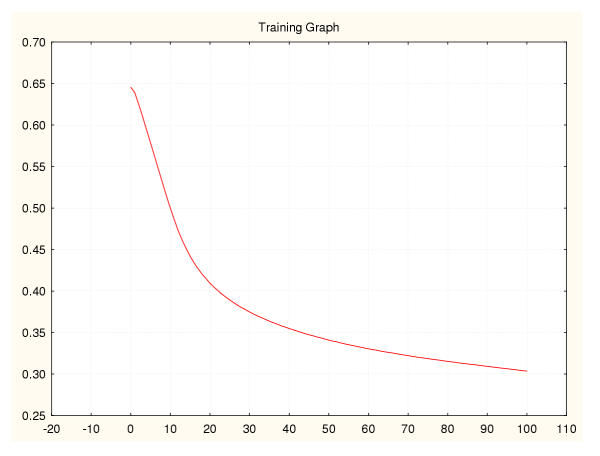
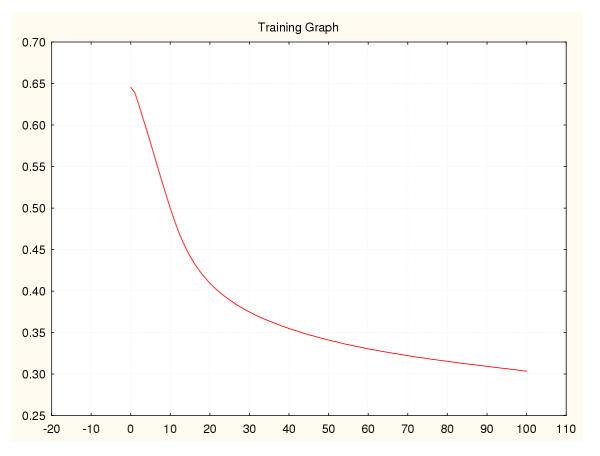
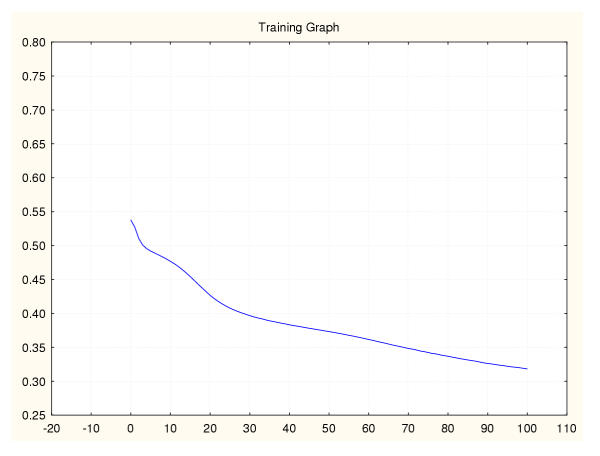
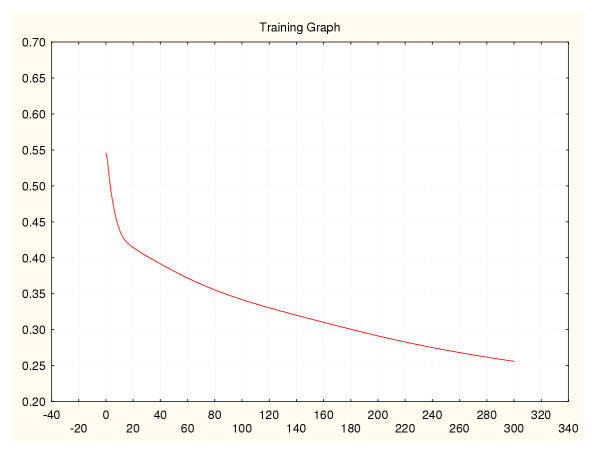
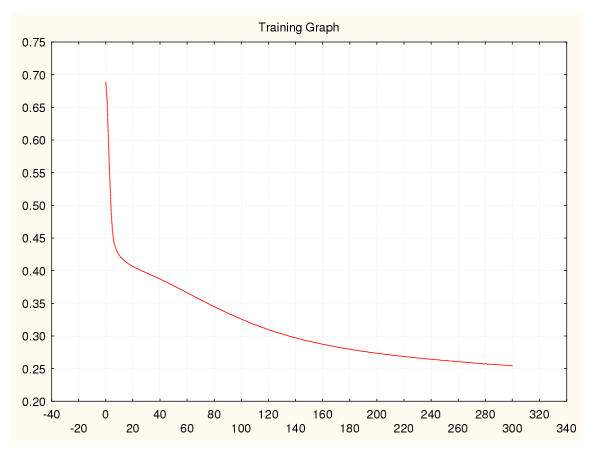
Results: Three data sampling techniques were studied: Cross-validation, leave-one-out, and bootstrap. These methods are designed to reduce the bias and variance of small-sample estimations. Two prediction problems based on small-sample sets were considered: Classification of microarray data originating from a leukemia study and from small, round blue-cell tumours. A third problem, the prediction of splice-junctions, was analysed to perform comparisons. Different accuracy estimations were produced for each problem. The variations are accentuated in the small-data samples. The quality of the estimates depends on the number of train-test experiments and the amount of data used for training the networks.

Conclusion: The predictive quality assessment of biomolecular data classifiers depends on the data size, sampling techniques and the number of train-test experiments. Conservative and optimistic accuracy estimations can be obtained by applying different methods. Guidelines are suggested to select a sampling technique according to the complexity of the prediction problem under consideration.


Figures

Figure 1
Figure 1
Accuracy estimation for leukaemia data classifier (I) Cross-validation method based on a 50%–50% splitting. Prediction accuracy values and the confidence intervals for the means (95% confidence) are depicted for a number of train-test runs. A: 10 train-test runs, B: 25 train-test runs, C: 50 train-test runs, D: 100 train-test runs, E: 500 train-test runs, F: 1000 train-test runs, G: 2000 train-test runs, H: 3000 train-test runs, I: 4000 train-test runs, J: 5000 train-test runs.
Figure 2
Figure 2
Accuracy estimation for leukaemia data classifier (II) Cross-validation method based on a 75%–25% splitting. Prediction accuracy values and the confidence intervals for the means (95% confidence) are depicted for a number of train-test runs. A: 10 train-test runs, B: 25 train-test runs, C: 50 train-test runs, D: 100 train-test runs, E: 500 train-test runs, F: 1000 train-test runs, G: 2000 train-test runs, H: 3000 train-test runs, I: 4000 train-test runs, J: 5000 train-test runs.
Figure 3
Figure 3
Accuracy estimation for leukaemia data classifier (III) Cross-validation method based on a 95%–5% splitting. Prediction accuracy values and the confidence intervals for the means (95% confidence) are depicted for a number of train-test runs. A: 10 train-test runs, B: 25 train-test runs, C: 50 train-test runs, D: 100 train-test runs, E: 500 train-test runs, F: 1000 train-test runs, G: 2000 train-test runs, H: 3000 train-test runs, I: 4000 train-test runs, J: 5000 train-test runs.
Figure 4
Figure 4
Accuracy estimation for leukaemia data classifier (IV) Bootstrap method. Prediction accuracy values and the confidence intervals for the means (95% confidence) are depicted for a number of train-test runs. A: 100 train-test runs, B: 200 train-test runs, C: 300 train-test runs, D: 400 train-test runs, E: 500 train-test runs, F: 600 train-test runs, G: 700 train-test runs, H: 800 train-test runs, I: 900 train-test runs, J: 1000 train-test runs.
Figure 5
Figure 5
Accuracy estimation for the SRBCT classifier (I) Cross-validation method based on a 50%–50% splitting. Prediction accuracy values and the confidence intervals for the means (95% confidence) are depicted for a number of train-test runs. A: 10 train-test runs, B: 25 train-test runs, C: 50 train-test runs, D: 100 train-test runs, E: 500 train-test runs, F: 1000 train-test runs, G: 2000 train-test runs, H: 3000 train-test runs, I: 4000 train-test runs, J: 5000 train-test runs.
Figure 6
Figure 6
Accuracy estimation for the SRBCT classifier (II) Cross-validation method based on a 75%–25% splitting. Prediction accuracy values and the confidence intervals for the means (95% confidence) are depicted for a number of train-test runs. A: 10 train-test runs, B: 25 train-test runs, C: 50 train-test runs, D: 100 train-test runs, E: 500 train-test runs, F: 1000 train-test runs, G: 2000 train-test runs, H: 3000 train-test runs, I: 4000 train-test runs, J: 5000 train-test runs.
Figure 7
Figure 7
Accuracy estimation for the SRBCT classifier (III) Cross-validation method based on a 95%–5% splitting. Prediction accuracy values and the confidence intervals for the means (95% confidence) are depicted for a number of train-test runs. A: 10 train-test runs, B: 25 train-test runs, C: 50 train-test runs, D: 100 train-test runs, E: 500 train-test runs, F: 1000 train-test runs, G: 2000 train-test runs, H: 3000 train-test runs, I: 4000 train-test runs, J: 5000 train-test runs.
Figure 8
Figure 8
Accuracy estimation for the SRBCT classifier (IV) Bootstrap method. Prediction accuracy values and the confidence intervals for the means (95% confidence) are depicted for a number of train-test runs. A: 100 train-test runs, B: 200 train-test runs, C: 300 train-test runs, D: 400 train-test runs, E: 500 train-test runs, F: 600 train-test runs, G: 700 train-test runs, H: 800 train-test runs, I: 900 train-test runs, J: 1000 train-test runs.
Figure 9
Figure 9
Accuracy estimation for the splice-junction sequence classifier (I) Cross-validation method based on a 50%–50% splitting. Prediction accuracy values and the confidence intervals for the means (95% confidence) are depicted for a number of train-test runs. A: 10 train-test runs, B: 25 train-test runs, C: 50 train-test runs, D: 100 train-test runs, E: 200 train-test runs, F: 300 train-test runs, G: 400 train-test runs, H: 500 train-test runs, I: 800 train-test runs, J: 1000 train-test runs.
Figure 10
Figure 10
Accuracy estimation for the splice-junction sequence classifier (II) Cross-validation method based on a 75%–25% splitting. Prediction accuracy values and the confidence intervals for the means (95% confidence) are depicted for a number of train-test runs. A: 10 train-test runs, B: 25 train-test runs, C: 50 train-test runs, D: 100 train-test runs, E: 200 train-test runs, F: 300 train-test runs, G: 400 train-test runs, H: 500 train-test runs, I: 800 train-test runs, J: 1000 train-test runs.
Figure 11
Figure 11
Accuracy estimation for the splice-junction sequence classifier (III) Cross-validation method based on a 95%–5% splitting. Prediction accuracy values and the confidence intervals for the means (95% confidence) are depicted for a number of train-test runs. A: 10 train-test runs, B: 25 train-test runs, C: 50 train-test runs, D: 100 train-test runs, E: 200 train-test runs, F: 300 train-test runs, G: 400 train-test runs, H: 500 train-test runs, I: 800 train-test runs, J: 1000 train-test runs.
Figure 12
Figure 12
Accuracy estimation for the splice-junction sequence classifier (IV) Bootstrap method. Prediction accuracy values and the confidence intervals for the means (95% confidence) are depicted for a number of train-test runs. A: 100 train-test runs, B: 200 train-test runs, C: 300 train-test runs, D: 400 train-test runs, E: 500 train-test runs, F: 600 train-test runs, G: 700 train-test runs, H: 800 train-test runs, I: 900 train-test runs, J: 1000 train-test runs.
Figure 13
Figure 13
Mean square error during training for a leukaemia classifier (I) 50%–50% data splitting.
Figure 14
Figure 14
Mean square error during training for a leukaemia classifier (II) 75%–25% data splitting.
Figure 15
Figure 15
Mean square error during training for a leukaemia classifier (III) 95%–5% data splitting.
Figure 16
Figure 16
Mean square error during training for a leukaemia classifier (IV) Leave-one-out data splitting.
Figure 17
Figure 17
Entropy error during training for a SRBCT classifier (I) 50%–50% data splitting.
Figure 18
Figure 18
Entropy error during training for a SRBCT classifier (II) 75%–5% data splitting.
Figure 19
Figure 19
Entropy error during training for a SRBCT classifier (III) 95%–5% data splitting.
Figure 20
Figure 20
Entropy error during training for a SRBCT classifier (IV) Leave-one-out data splitting.
Figure 21
Figure 21
Entropy error during training for a splice-junction classifier (I) 50%–50% data splitting.
Figure 22
Figure 22
Entropy error during training for a splice-junction classifier (II) 75%–5% data splitting.
Figure 23
Figure 23
Entropy error during training for a splice-junction classifier (III) 95%–5% data splitting.
Figure 24
Figure 24
Entropy error during training for a splice-junction classifier (IV) Leave-one-out data splitting.

Similar articles

Cited by

References

    1. Welle S, Brooks AI, Thornton CA. Computational method for reducing variance with Affymetrix microarrays. BMC Bioinformatics. 2002;3:23. doi: 10.1186/1471-2105-3-23. - DOI - PMC - PubMed
    1. Azuaje F. In Silico Approaches to Microarray-Based Disease Classification and Gene Function Discovery. Annals of Medicine. 2002;34:299–305. doi: 10.1080/078538902320322565. - DOI - PubMed
    1. Ideker T, Thorsson V, Ranish J, Christmas R, Buhler J, Eng J, Bumgarner R, Goodlett D, Aebersol R, Hood L. Integrated genomic and proteomic analyses of a systematically perturbated metabolic network. Science. 2001;292:929–933. doi: 10.1126/science.292.5518.929. - DOI - PubMed
    1. Bittner M, Meltzer P, Chen Y, Jiang Y, Seftor E, Hendrix M, Radmacher M, Simon R, Yakhini Z, Ben-Dor A, Sampas N, Dougherty E, Wang E, Marincola F, Gooden C, Lueders J, Glatfelter A, Pollock P, Carpten J, Gillanders E, Leja D, Dietrich K, Beaudry C, Berens M, Alberts D, Sondak V, Hayward N, Trent J. Molecular classification of cutaneous malignant melanoma by gene expression profiling. Nature. 2000;406:536–540. doi: 10.1038/35020115. - DOI - PubMed
    1. Azuaje F. A Computational neural approach to support the discovery of gene function and classes of cancer. IEEE Transactions on Biomedical Engineering. 2001;48:332–339. doi: 10.1109/10.914796. - DOI - PubMed

Publication types

MeSH terms

Substances

LinkOut - more resources