. 2003 Feb 3;22(3):418-26.
doi: 10.1093/emboj/cdg073.

H+/ATP ratio of proton transport-coupled ATP synthesis and hydrolysis catalysed by CF0F1-liposomes

Affiliations

H+/ATP ratio of proton transport-coupled ATP synthesis and hydrolysis catalysed by CF0F1-liposomes

Paola Turina et al. EMBO J. .

Abstract

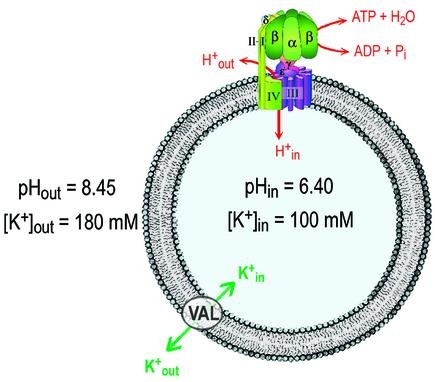
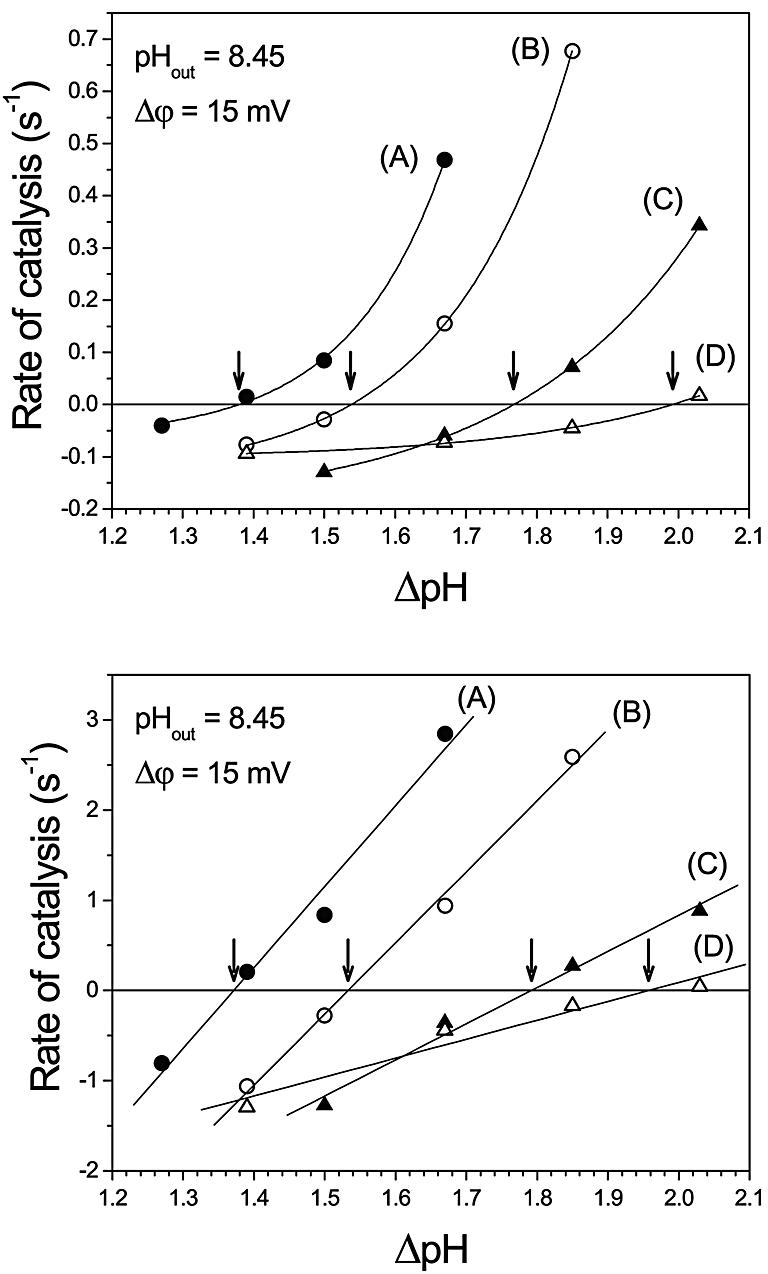
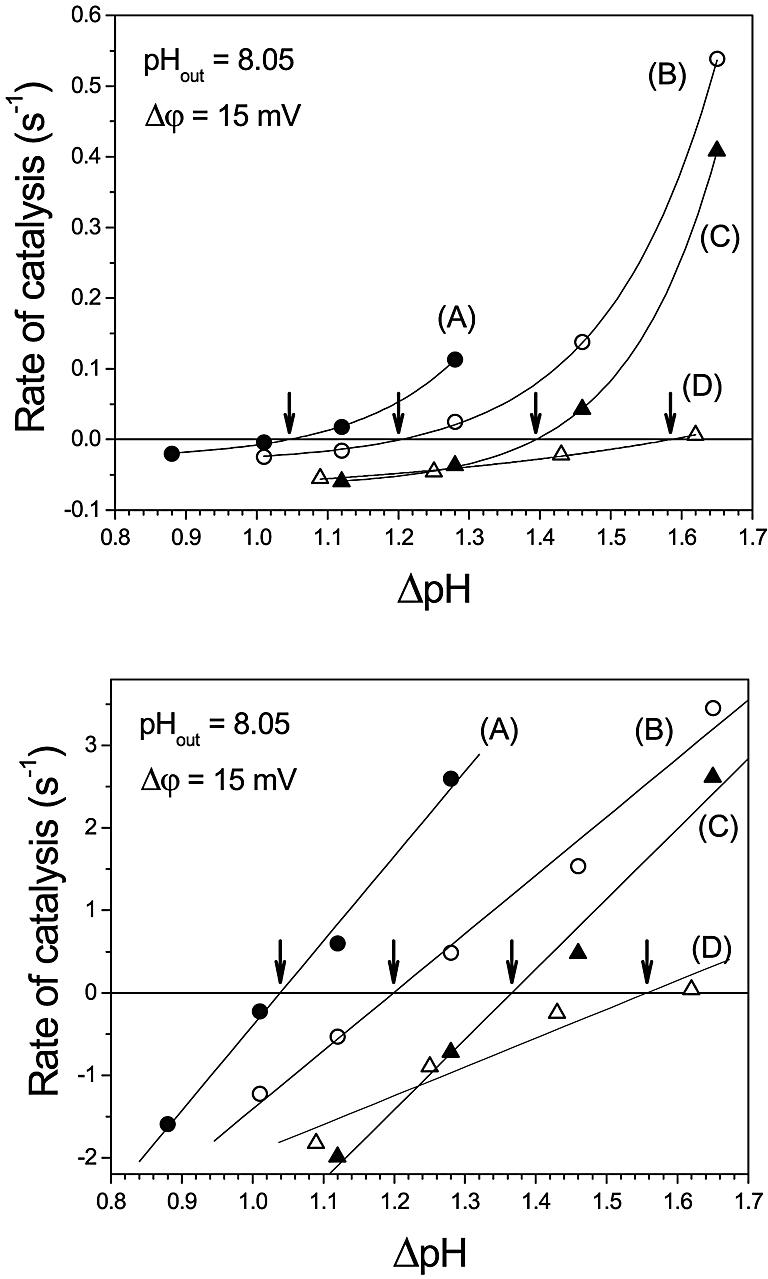
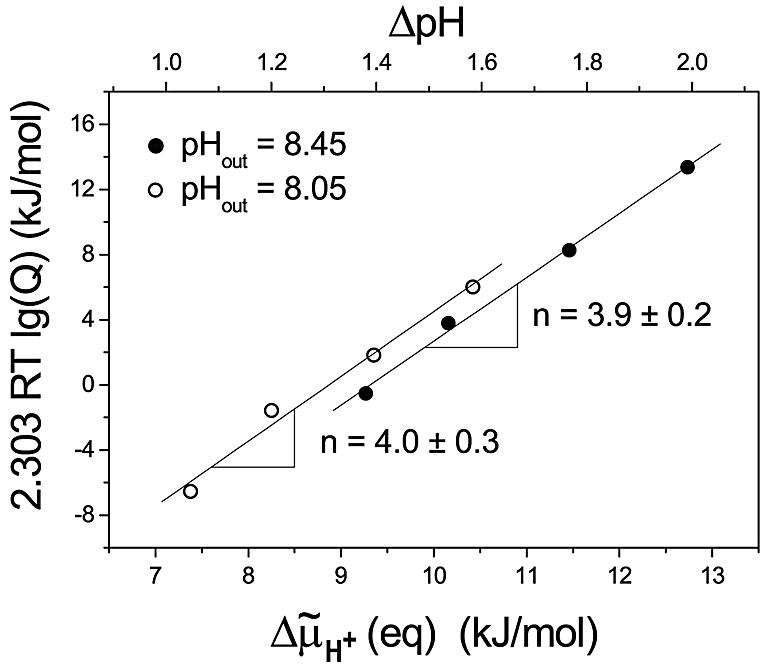
The H(+)/ATP ratio and the standard Gibbs free energy of ATP synthesis were determined with a new method using a chemiosmotic model system. The purified H(+)-translocating ATP synthase from chloroplasts was reconstituted into phosphatidylcholine/phosphatidic acid liposomes. During reconstitution, the internal phase was equilibrated with the reconstitution medium, and thereby the pH of the internal liposomal phase, pH(in), could be measured with a conventional glass electrode. The rates of ATP synthesis and hydrolysis were measured with the luciferin/luciferase assay after an acid-base transition at different [ATP]/([ADP][P(i)]) ratios as a function of deltapH, analysing the range from the ATP synthesis to the ATP hydrolysis direction and the deltapH at equilibrium, deltapH (eq) (zero net rate), was determined. The analysis of the [ATP]/([ADP][P(i)]) ratio as a function of deltapH (eq) and of the transmembrane electrochemical potential difference, delta micro approximately (H)(+) (eq), resulted in H(+)/ATP ratios of 3.9 +/- 0.2 at pH 8.45 and 4.0 +/- 0.3 at pH 8.05. The standard Gibbs free energies of ATP synthesis were determined to be 37 +/- 2 kJ/mol at pH 8.45 and 36 +/- 3 kJ/mol at pH 8.05.


Figures

None
Fig. 1. Scheme of the chemiosmotic system. Liposomes were made from phosphatidylcholine and contained 5 mol% phosphatidic acid. Their mean diameter was 120 nm, containing 1.3 × 10⁵ lipid molecules and one CF0F1. Each liposome contained ∼800 valinomycin molecules.
None
Fig. 2. ATP synthesis and ATP hydrolysis after generation of a transmembrane ΔpH. Proteoliposomes were incubated in the acidic medium containing luciferin/luciferase for 30 s and the baseline was registered. The acid–base transition was carried out in the luminometer by addition of 250 µl of basic medium. The final pHout was always 8.45 and the final CF0F1 concentration 7.6 nM. This addition gives rise to an immediate change in the baseline. For clarity, the baseline was shifted to the luminescence level obtained in the absence of any reaction. This step is followed by a slow luminescence increase (ATP synthesis) or decrease (ATP hydrolysis). (AD) refer to different stoichiometric ratios Q; the concentrations of substrates, products and Q are listed in Table II. The luminescence was calibrated by addition of standard ATP. The different ΔpH values are given next to each trace. The slopes at t = 0 give the initial rates in mol ATP per mol CF0F1 per s, i.e. in s–1.
None
Fig. 3. Rate of ATP synthesis and ATP hydrolysis as a function of the transmembrane ΔpH at pHout = 8.45. Each curve represents data at constant stoichiometric ratio Q: 0.805 (A), 4.65 (B), 28.7 (C) and 230 (D). Arrows indicate ΔpHeq, where the rates of ATP synthesis and ATP hydrolysis are equal. Top: data from Figure 2. Bottom: the data from Figure 2 were corrected for activation as described in the text.
None
Fig. 4. Rate of ATP synthesis and ATP hydrolysis as a function of the transmembrane ΔpH at pHout = 8.05. Each curve represents data at constant stoichiometric ratio Q: 0.07 (A), 0.52 (B), 2.07 (C) and 11.6 (D). Arrows indicate ΔpHeq, where the rates of ATP synthesis and ATP hydrolysis are equal. Top: measured rates from experiments similar to that described in Figure 2. Bottom: the data from the top were corrected for activation as described in the text.
None
Fig. 5. Stoichiometric product [ATP]/([ADP] [Pi]) as a function of Δµ̃H+ (eq). Data from Figures 3 and 4 and Table II were plotted according to equation 4. The slopes give the number n; the y-intercepts give the standard Gibbs free energies ΔGp°′ at pHout = 8.05 and pHout = 8.45.
None

Similar articles

Cited by

References

    1. Böttcher B. and Gräber,P. (2000) The structure of the H+-ATP synthase from chloroplasts and its subcomplexes as revealed by electron microscopy. Biochim. Biophys. Acta, 1458, 404–416. - PubMed
    1. Boyer P.D. (1998) ATP synthase—past and future. Biochim. Biophys. Acta, 1365, 3–9. - PubMed
    1. Davenport J.W. and McCarty,R.E. (1984) An analysis of proton fluxes coupled to electron transport and ATP synthesis in chloroplast thylakoids. Biochim. Biophys. Acta, 766, 363–374.
    1. Duncan T.M., Bulygin,V.V., Zhou,Y., Hutcheon,M.L. and Cross,R.L. (1995) Rotation of subunits during catalysis by Escherichia coli F1-ATPase. Proc. Natl Acad. Sci. USA, 92, 10964–10968. - PMC - PubMed
    1. Ferguson S.J. (2000) ATP synthase: what dictated the size of a ring? Curr. Biol., 10, R804–R808. - PubMed

Publication types

MeSH terms