. 2003 Feb 3;22(3):676-88.
doi: 10.1093/emboj/cdg053.

ATP binding by glutamyl-tRNA synthetase is switched to the productive mode by tRNA binding

Affiliations

ATP binding by glutamyl-tRNA synthetase is switched to the productive mode by tRNA binding

Shun-Ichi Sekine et al. EMBO J. .

Abstract

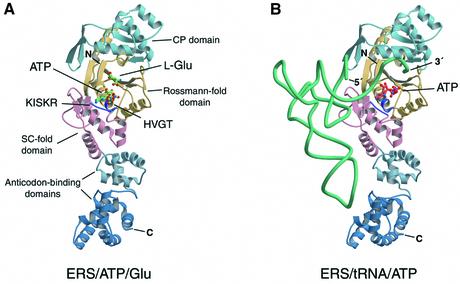
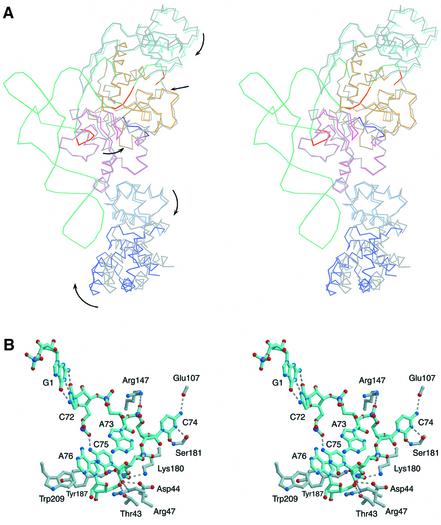
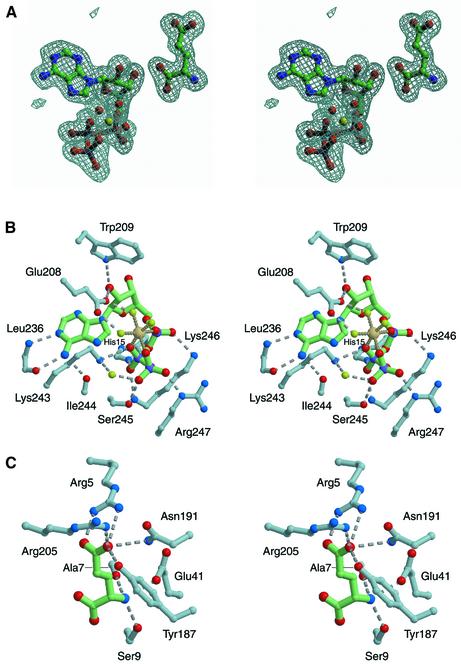
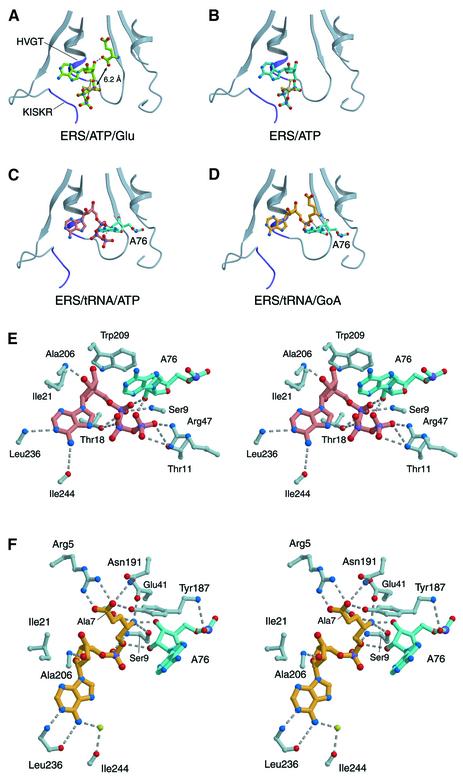
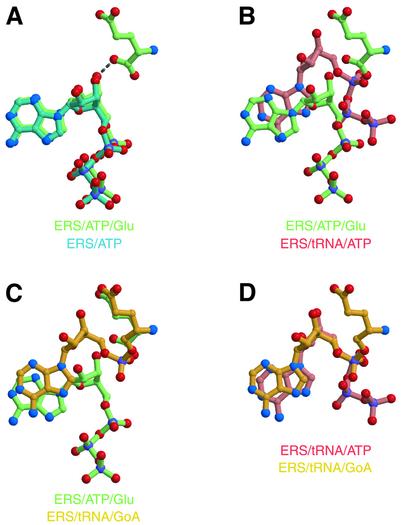
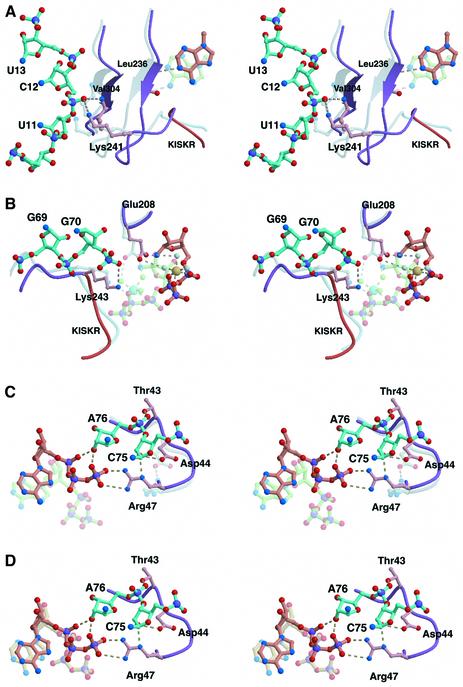
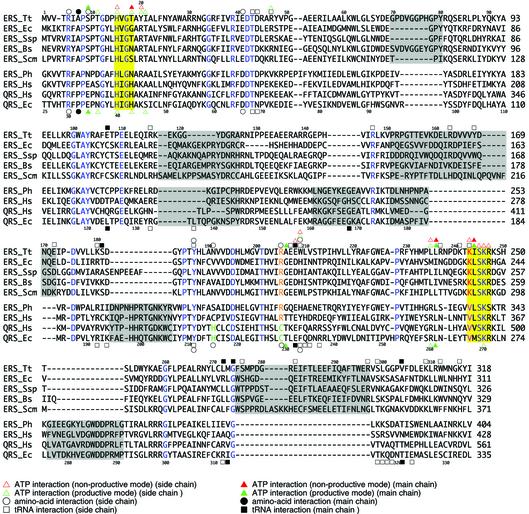
Aminoacyl-tRNA synthetases catalyze the formation of an aminoacyl-AMP from an amino acid and ATP, prior to the aminoacyl transfer to tRNA. A subset of aminoacyl-tRNA synthetases, including glutamyl-tRNA synthetase (GluRS), have a regulation mechanism to avoid aminoacyl-AMP formation in the absence of tRNA. In this study, we determined the crystal structure of the 'non-productive' complex of Thermus thermophilus GluRS, ATP and L-glutamate, together with those of the GluRS.ATP, GluRS.tRNA.ATP and GluRS.tRNA.GoA (a glutamyl-AMP analog) complexes. In the absence of tRNA(Glu), ATP is accommodated in a 'non-productive' subsite within the ATP-binding site, so that the ATP alpha-phosphate and the glutamate alpha-carboxyl groups in GluRS. ATP.Glu are too far from each other (6.2 A) to react. In contrast, the ATP-binding mode in GluRS.tRNA. ATP is dramatically different from those in GluRS.ATP.Glu and GluRS.ATP, but corresponds to the AMP moiety binding mode in GluRS.tRNA.GoA (the 'productive' subsite). Therefore, tRNA binding to GluRS switches the ATP-binding mode. The interactions of the three tRNA(Glu) regions with GluRS cause conformational changes around the ATP-binding site, and allow ATP to bind to the 'productive' subsite.


Figures

None
Fig. 1. Thermus thermophilus GluRS crystal structures. (A) Ribbon representation of the ERS/ATP/Glu structure. Five domains, the Rossmann fold (1), connective peptide (or acceptor-binding) (2), stem-contact fold (3) and two anticodon-binding (4 and 5) domains, are colored khaki, light blue, pink, steel blue and deep blue, respectively. The HVGT and KISKR motifs of GluRS are highlighted in purple. The ATP and glutamate molecules in the GluRS catalytic pocket are shown in green. (B) Overall structure of ERS/tRNA/ATP. The ATP and tRNAGlu molecules in the complex are shown in orange and turquoise, respectively. These figures were produced using the MOLSCRIPT (Kraulis, 1991) and RASTER3D (Merritt and Murphy, 1994) programs.
None
Fig. 2. Conformational changes within GluRS upon tRNAGlu binding. (A) The ERS/tRNA/GoA backbone structure was superposed on that of ERS/ATP/Glu by the enzyme catalytic core (domains 1 and 3) (stereo view). The entire ERS/ATP/Glu structure is colored gray, while the ERS/tRNA/GoA structure is colored as in Figure 1B. The arrows indicate the tRNA-induced conformational changes within GluRS. Three tRNA regions involved in the enzyme active site rearrangement are highlighted in orange. (B) A stereo view showing the 3′-terminal region of the tRNAGlu in ERS/tRNA/GoA, and its interactions with GluRS. These interactions are the same as those observed in ERS/tRNA/ATP.
None
Fig. 3. The ATP and glutamate molecules in ERS/ATP/Glu. (A) A stereo view of the electron density, showing the ATP-Mg2+ and glutamate molecules in ERS/ATP/Glu. An annealed |Fo – Fc| omit electron density map was calculated using all of the data from 40 to 1.8 Å resolution and the complex model without the ATP-Mg2+ and glutamate. The refined models of the ATP-Mg2+ and glutamate are superimposed on the density countered at 3σ. The Mg2+ ion is shown by a yellow sphere. The average distance between the Mg2+ ion and the six liganded oxygen atoms is 2.02 Å. (B) ATP recognition in ERS/ATP/Glu (stereo view). The ATP recognition in this complex is the same as that in ERS/ATP. (C) Glutamate recognition in ERS/ATP/Glu (stereo view).
None
Fig. 4. Substrate/ligand(s) binding in the GluRS complexes. (A–D) The GluRS catalytic site structures in the present complexes are shown in the same orientation. The HVGT and KISKR motifs are highlighted in purple. (A) The ERS/ATP/Glu structure. The ATP-Mg2+ and glutamate molecules are shown in green. (B) The ERS/ATP structure. The ATP-Mg2+ is colored light blue. (C) The ERS/tRNA/ATP structure. The ATP molecule is colored salmon, and the 3′-terminal adenosine (A76) of tRNAGlu is cyan. (D) The ERS/tRNA/GoA structure. The GoA (glutamol-AMP) molecule is colored yellow. (E) A stereo view showing the ATP recognition in ERS/tRNA/ATP. (F) A stereo view showing the GoA recognition in ERS/tRNA/GoA.
None
Fig. 5. Comparisons of the substrate/ligand positions among the GluRS complexes. (A) The ATP molecule (light blue) in ERS/ATP is compared with the ATP and glutamate (green) in ERS/ATP/Glu by superposition of the enzyme catalytic site structures. (B) The ATP (salmon) in ERS/tRNA/ATP is compared with the ATP and glutamate (green) in ERS/ATP/Glu by superposition. (C) The GoA (yellow) in ERS/tRNA/GoA is compared with the ATP and glutamate (green) in ERS/ATP/Glu by superposition. (D) The GoA (yellow) in ERS/tRNA/GoA is compared with the ATP (salmon) in ERS/tRNA/ATP by superposition.
None
Fig. 6. Catalytic site rearrangement within GluRS upon binding with tRNAGlu. The GluRS catalytic site structure in ERS/tRNA/ATP (purple) was compared with that in ERS/ATP (steel blue) by superposition. The ATP and portions of tRNAGlu in ERS/tRNA/ATP are shown in salmon and cyan, respectively, and the ATP molecule in ERS/ATP is in green. (A) The D stem interactions. (B) The acceptor stem interactions. An Mg2+ ion (a large yellow sphere) and its associated water molecules (light blue) are modeled for the ATP molecule in ERS/tRNA/ATP. (C) The 3′-CCA end interactions. (D) The ATP molecule (salmon) in one ERS/tRNA/ATP complex (3a) in the crystallographic asymmetric unit is compared with the ATP (beige) in the other complex (3b).
None
Fig. 7. Alignment of the amino acid sequences of GluRSs and GlnRSs. The amino acid sequences corresponding to the N-terminal halves (domains 1–3) of GluRSs and GlnRSs are compared based on the present T.thermophilus GluRS structures and E.coli GlnRS structures (Rould et al., 1989; Rath et al., 1998). Tt, T.thermophilus; Ec, E.coli; Ssp, Synechocystis sp.; Bs, Bacillus subtilis; Scm, Saccharomyces cerevisiae mitochondria; Ph, P.horikoshii; Hs, Homo sapiens. Amino acid residues conserved throughout the GlxRS family are colored blue. The ‘HIGH’ and ‘KMSKS’ motifs are highlighted in yellow. Amino acid residues conserved specifically in bacterial/organellar GluRSs are colored red, while those conserved in archaeal/eukaryal GluRSs and GlnRSs are shown in violet. The specific insertion sequences in both lineages are shown by gray zones. The GluRS- and GlnRS-specific residues for amino acid recognition are colored orange and green, respectively. Symbols above the T.thermophilus GluRS sequence and below the E.coli GlnRS sequence indicate that the marked residues are involved in the substrate interaction(s) in the structures of GluRS (the present study) and GlnRS (Rould et al., 1989; Rath et al., 1998), respectively [interactions of ATP (triangle), amino acid (circle) and tRNA (square) with the side chain (open symbol) and the main chain (closed symbol) of the protein residue]. For the ATP interactions, the ‘productive’ and ‘non-productive’ modes are indicated in green and red, respectively.

References

    1. Brünger A.T. et al. (1998) Crystallography and NMR system: a new software suite for macromolecular structure determination. Acta Crystallogr. D, 54, 905–921. - PubMed
    1. Cavarelli J., Delagoutte,B., Eriani,G., Gangloff,J. and Moras,D. (1998) l-Arginine recognition by yeast arginyl-tRNA synthetase. EMBO J., 17, 5438–5448. - PMC - PubMed
    1. CCP4 (1994) The CCP4 suite: programs for protein crystallography. Acta Crystallogr. D, 50, 760–763. - PubMed
    1. Csonka L.N. (1989) Physiological and genetic responses of bacteria to osmotic stress. Microbiol. Rev., 53, 121–147. - PMC - PubMed
    1. Cusack S. (1995) Eleven down and nine to go. Nat. Struct. Biol., 2, 824–831. - PubMed

Publication types

MeSH terms