. 2003 Mar;17(3):333-45.
doi: 10.1210/me.2002-0136. Epub 2002 Dec 12.

Imaging the localized protein interactions between Pit-1 and the CCAAT/enhancer binding protein alpha in the living pituitary cell nucleus

Affiliations

Imaging the localized protein interactions between Pit-1 and the CCAAT/enhancer binding protein alpha in the living pituitary cell nucleus

Richard N Day et al. Mol Endocrinol. 2003 Mar.

Abstract

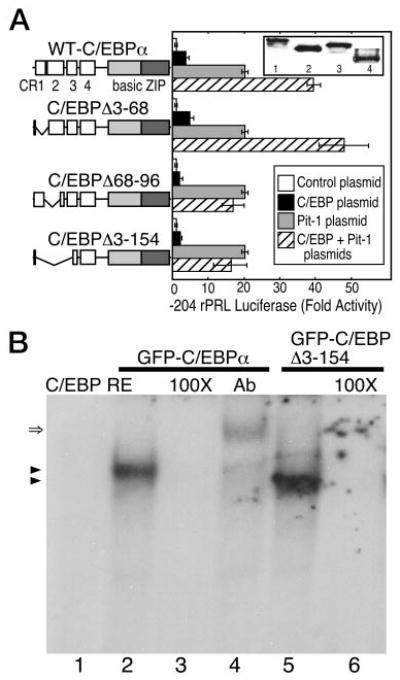
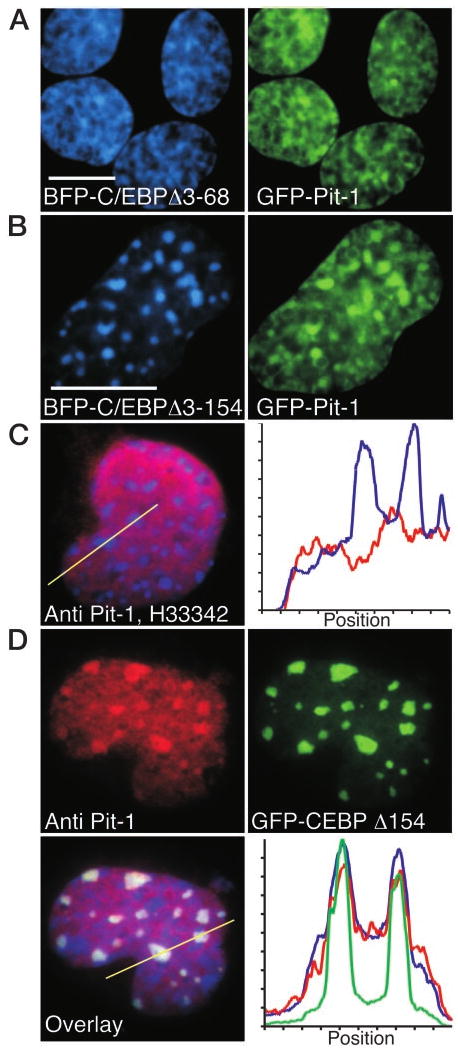
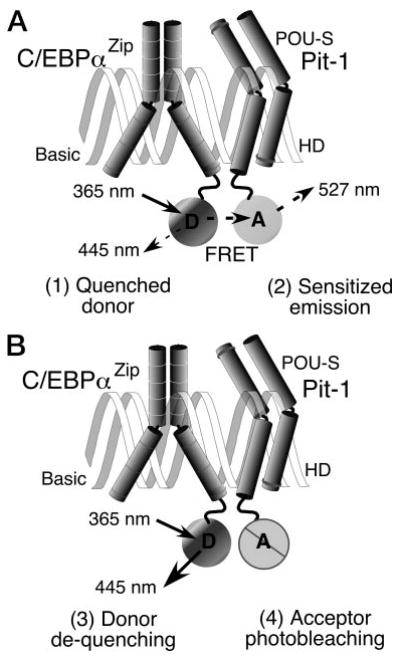
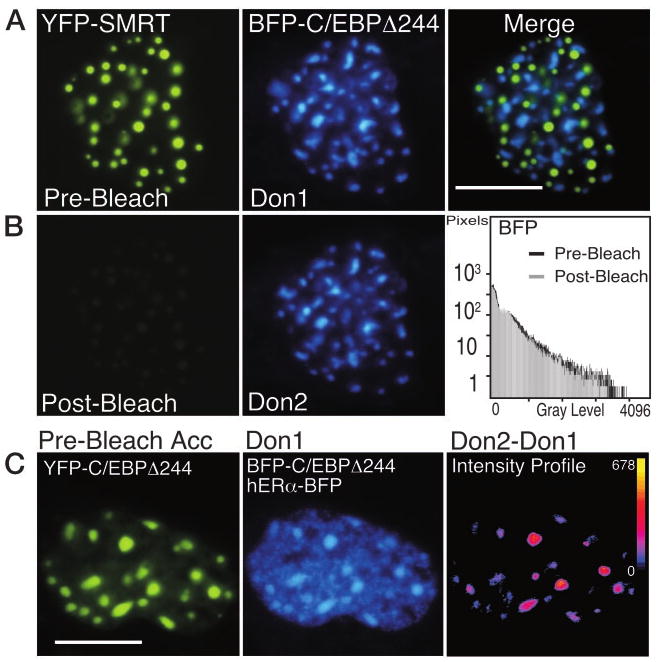
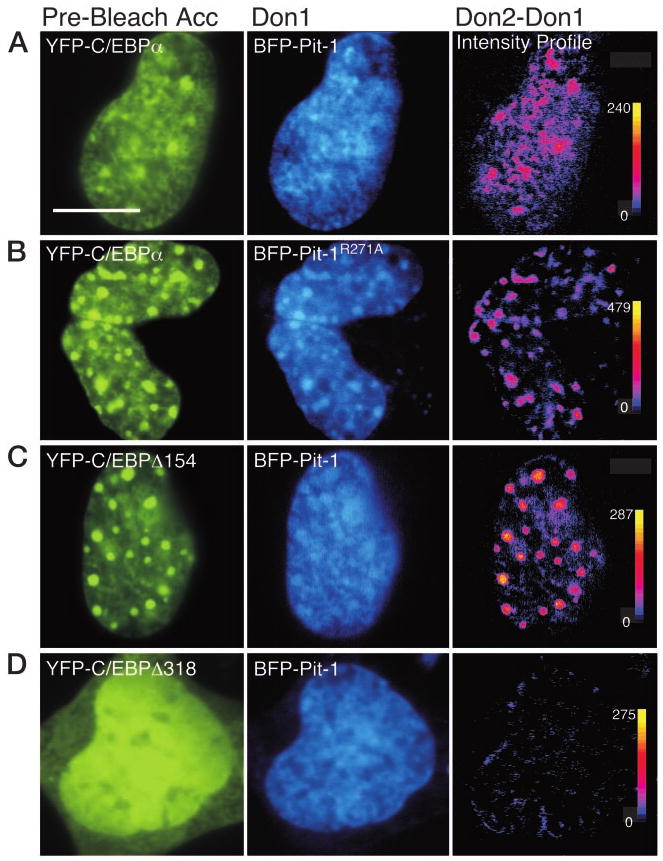
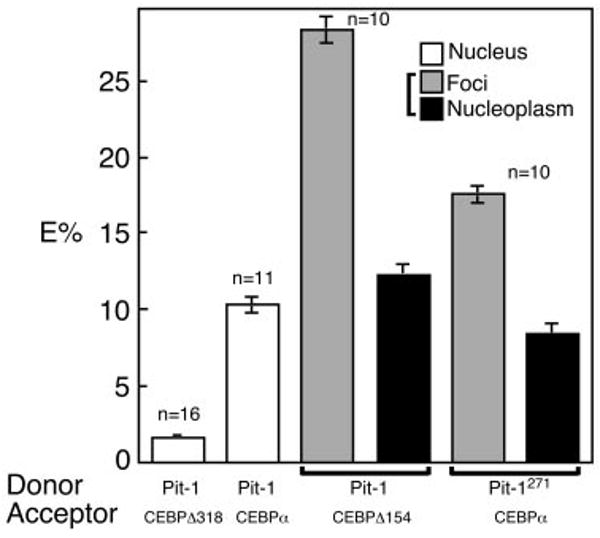
The homeodomain protein Pit-1 cooperates with the basic-leucine zipper protein CCAAT/enhancer binding protein alpha (C/EBPalpha) to control pituitary-specific prolactin gene transcription. We previously observed that C/EBPalpha was concentrated in regions of centromeric heterochromatin in pituitary GHFT1-5 cells and that coexpressed Pit-1 redistributed C/EBPalpha to the subnuclear sites occupied by Pit-1. Here, we used fluorescence resonance energy transfer microscopy to show that when C/EBPalpha was recruited by Pit-1, the average distance separating the fluorophores labeling the proteins was less than 7 nm. A mutation in the Pit-1 homeodomain, or truncation of the C/EBPalpha transactivation domain disrupted the redistribution of C/EBPalpha by Pit-1. Fluorescence resonance energy transfer analysis revealed that the mutant Pit-1 still associated with C/EBPalpha, and the truncated C/EBPalpha still associated with Pit-1, but these interactions were preferentially localized in regions of centromeric heterochromatin. In contrast, a truncation in C/EBPalpha that prevented DNA binding also blocked its association with Pit-1, suggesting that the binding of C/EBPalpha to DNA is a critical first step in specifying its association with Pit-1. These findings indicated that the protein domains that specify the interaction of Pit-1 and C/EBPalpha are separable from the protein domains that direct the positioning of the associated proteins within the nucleus. The intimate association of Pit-1 and C/EBPalpha at certain sites within the living cell nucleus could foster their combinatorial activities in the regulation of pituitary-specific gene expression.


Figures

Fig. 1
Fig. 1. The CR-2 Domain of C/EBPα Is Required for Induction of Pit-1-Dependent Transcription
A, HeLa cells were transfected with the −204 rat PRL promoter linked to the Luc reporter gene and the indicated protein expression vectors. The cells were cotransfected with plasmids encoding either the full-length rat C/EBPα or the indicated truncations (10 μg, black bars) or 5 μg of the Pit-1 expression plasmid (gray bars) or the combination of both (hatched bars). Inset, Western blot showing the expressed C/EBPα proteins: lane 1, full-length C/EBPα; lane 2, C/EBPα (Δ3–68); lane 3, C/EBPα (Δ68–96); lane 4, C/EBPα (Δ3–154). Luciferase activity was determined after 24 h and was corrected for total protein. The error is the sem from three independent experiments, each in triplicate and normalized to reporter alone. B, EMSA showing that GFP-C/EBPα (lanes 1–4) and GFP-C/EBPΔ3–154 have similar DNA binding characteristics. Cell extracts were prepared from 3T3-L1 cells expressing the indicated protein, and samples were incubated with a labeled C/EBPα RE as described in Materials and Methods. After gel electrophoresis, a single DNA-protein complex was observed for each protein (arrowheads). Binding specificity was demonstrated by competition with an 100-fold excess of unlabeled oligonucleotide (lanes 3 and 6). The presence of the full-length C/EBPα in the complex was verified by a shift in mobility resulting from the addition of an antibody specific for C/EBPα (double arrow, lane 4).
Fig. 2
Fig. 2. Both Expressed and Endogenous Pit-1 Colocalized with C/EBPα
A and B, When coexpressed, GFP-Pit-1 recruited BFP-C/EBPΔ3–68, but not BFP-C/EBPΔ3–154, to the intranuclear domains occupied by Pit-1. Sequential images were acquired of GHFT1–5 cells coexpressing BFP-C/EBPΔ3–68 and GFP-Pit-1 (A) or BFP-C/EBPΔ3–154 and GFP-Pit-1 (B), as described in Materials and Methods. The calibration bars indicate 10 μm. C, Immunohistochemical staining of endogenous Pit-1 in a mouse GHFT1–5 cell. The endogenous Pit-1 was detected with antisera to Pit-1 and a Texas red-linked secondary antibody, and staining with H33342 revealed regions of heterochromatin. The red Pit-1 and blue H33342 fluorescence images were merged, and an intensity profile was obtained for both Texas red emission (red line) and H33342 fluorescence (blue line), and the position indicated by the line was plotted (right panel). D, Immunohistochemical detection of Pit-1 in a mouse GHFT1–5 cell expressing the truncated GFP-C/EBPΔ154. Staining for the endogenous Pit-1 was detected in the red channel, the expressed GFP-C/EBPΔ154 was detected in the green channel, and chromatin stained with H33342 was detected in the blue channel. The different fluorescence images were merged, and an intensity profile obtained for all three colors at the position indicted by the line was plotted (right panel).
Fig. 3
Fig. 3. FRET Microscopy Improves the Optical Resolution
The diffraction of light limits the resolution of the microscope to 200 nm, and objects that are closer together than this will appear as a single object. A, It is possible to realize a 50-fold increase in spatial resolution by using the technique of FRET microscopy. FRET is the radiationless transfer of energy from a donor fluorophore (D) to nearby acceptors (A), resulting in (1) quenching of the donor signal, and (2) sensitized emission from the acceptor. The efficiency of the energy transfer decreases dramatically with distance, limiting FRET to distances less than 7 nm. B, Because the donor emission is quenched with FRET, detecting the (3) dequenching of the donor signal after (4) selective photobleaching of the acceptor provides a direct measurement of FRET efficiency.
Fig. 4
Fig. 4. The Photobleaching of YFP Is Selective
A, Pituitary GHFT1–5 cells were cotransfected with plasmids encoding the corepressor protein SMRT, tagged with YFP, and the C/EBPΔ244 deletion mutant fused to BFP. Sequential images of the nucleus of a cell coexpressing the proteins were acquired at the same focal plane using the filters described in Materials and Methods. The calibration bar indicates 10 μm. The images were merged to show that the proteins were each localized to discrete subnuclear foci. B, The YFP-SMRT was photobleached by 5 min of exposure to 500-nm light. Postbleach images were acquired at the same focal plane and under identical conditions to document the bleaching of YFP and to show that this had no effect on the BFP signal (histogram). C, Acceptor photobleaching FRET measurements detect only specific protein associations. Pituitary GHFT1–5 cells were cotransfected with plasmids encoding both YFP- and BFP-C/EBPΔ244, and hERα-BFP, and cells were identified that expressed all three labeled proteins. The prebleach images of the acceptor, YFP-C/EBPΔ244 (left panel), and the combined fluorescence from the donor, BFP-C/EBP Δ244 (foci) and the nucleoplasmic-localized hERα-BFP (Don1) are shown. The YFP fluorophore was bleached by greater than 90%, and a second donor image (Don2) was acquired at the same focal plane and under identical conditions as the first. The pixel-by-pixel change in gray-level intensity of the donor signal was obtained by digital subtraction of the Don1 image from the Don2 image. The intensity profile (right panel) represents the change in the gray-level intensities in the dequenched donor image (Don2 − Don1). The calibration bar shows the range of gray-level intensities in the dequenched image with black indicating 0 and yellow indicating the maximum gray-level value (shown next to the calibration bar). Note that the increase in donor intensity was limited to the foci.
Fig. 5
Fig. 5. Acceptor Photobleaching FRET Microscopy Detects the Interactions of Pit-1 and C/EBPα
Prebleach acceptor (YFP) and donor (BFP) images are shown for each of the panels A–D. A second donor image (Don2) was acquired at the same focal plane and under identical conditions as the first (Don1) image after acceptor (YFP) photobleaching. The dequenched donor signal (Don2 − Don) was then determined as described in the legend for Fig. 4. For each dequenched donor image, the pixel-by-pixel change in gray-level intensity is shown in the intensity profile (right panels), with black indicating 0 and yellow indicating the maximum gray-level value (shown next to each calibration bar). A, The prebleach acceptor and donor images showing the recruitment of YFP-C/EBPα by BFP-Pit-1 (Don1); the bar indicates 10 μm. The dequenched donor (Don2 − Don1) intensity profile is shown in the right panel. B, The prebleach acceptor and donor images showing subnuclear distribution of YFP-C/EBPα and the mutant Pit-1R271A labeled with BFP (Don1). The dequenched donor (Don2 − Don1) intensity profile is shown in the right panel. C, The prebleach acceptor and donor images showing subnuclear distribution of YFP-C/EBPΔ154 and BFP-Pit-1 (Don1). The dequenched donor (Don2 − Don1) intensity profile is shown in the right panel. D, The prebleach acceptor and donor images showing subnuclear distribution of YFP-C/EBPΔ318 and BFP-Pit-1 (Don1). The dequenched donor (Don2 − Don1) intensity profile is shown in the right panel.
Fig. 6
Fig. 6. The FRET Efficiency (E%) for Paired Pit-1 and C/EBPα Protein Variants Measured in Multiple Cells
The indicated number (n) of cells, each expressing the donor and acceptor pairs shown below the graph, were analyzed for changes in donor fluorescence after acceptor photobleaching. For protein pairs distributed throughout nucleus (open bars), the average gray-level intensity was determined for the entire nucleus in both the pre- and postbleach donor images. The average E% (±sem) was then determined using the equation shown in the footnotes of Table 1. For protein pairs that were distributed to both foci and nucleoplasm, the average donor gray-level intensity was determined for 10 different ROIs in each region that were identically positioned in both the pre- and postbleach donor images. All ROIs were of identical size. The E% for the foci (gray bars) or nucleoplasm (black bars) in each cell was determined, and the average E% (±sem) for the indicated number of cells is plotted.

Similar articles

Cited by

References

    1. Gutierrez-Hartmann A. INSIGHT: Pit-1/GHF-1: a pituitary-specific transcription factor linking general signaling pathways to cell-specific gene expression. Mol Endocrinol. 1994;8:1447–1449. - PubMed
    1. Dasen JS, Rosenfeld MG. Combinatorial codes in signaling and synergy: lessons from pituitary development. Curr Opin Genet Dev. 1999;9:566–574. - PubMed
    1. Schaufele F. CCAAT/enhancer-binding protein α activation of the rat growth hormone promoter in pituitary progenitor GHFT1–5 cells. J Biol Chem. 1996;271:21484–21489. - PubMed
    1. Jacob KK, Stanley FM. CCAAT/enhancer-binding protein α is a physiological regulator of prolactin gene expression. Endocrinology. 1999;140:4542–4550. - PubMed
    1. Pombo A, Cuello P, Schul W, Yoon JB, Roeder RG, Cook PR, Murphy S. Regional and temporal specialization in the nucleus: a transcriptionally-active nuclear domain rich in PTF, Oct1 and PIKA antigens associates with specific chromosomes early in the cell cycle. EMBO J. 1998;17:1768–1778. - PMC - PubMed

Publication types

MeSH terms