. 2003 Feb;23(4):1135-50.
doi: 10.1128/MCB.23.4.1135-1150.2003.

Effect of the pheromone-responsive G(alpha) and phosphatase proteins of Saccharomyces cerevisiae on the subcellular localization of the Fus3 mitogen-activated protein kinase

Affiliations

Effect of the pheromone-responsive G(alpha) and phosphatase proteins of Saccharomyces cerevisiae on the subcellular localization of the Fus3 mitogen-activated protein kinase

Ernest Blackwell et al. Mol Cell Biol. 2003 Feb.

Abstract

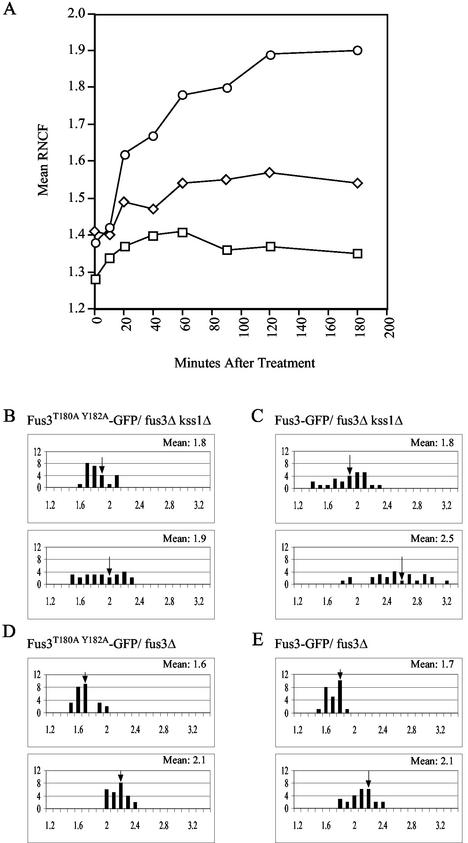
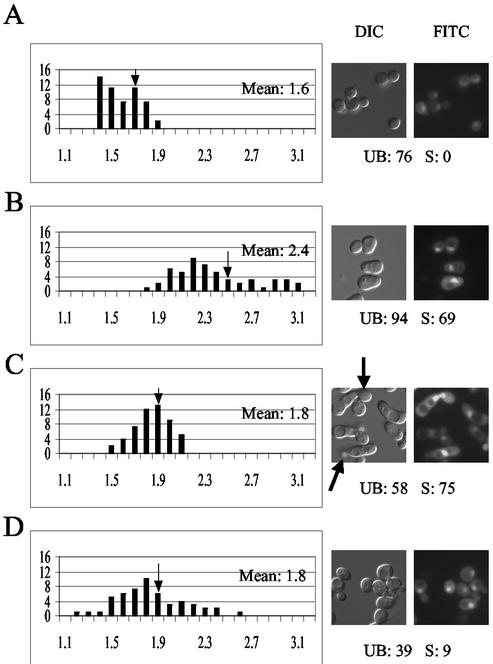
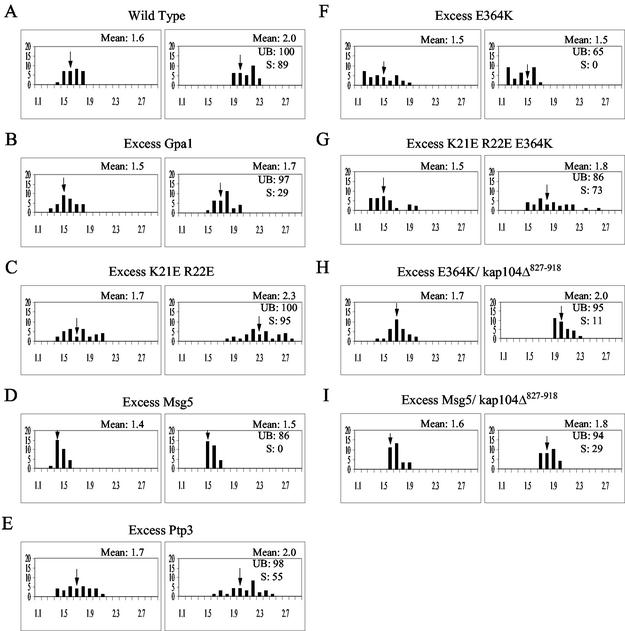
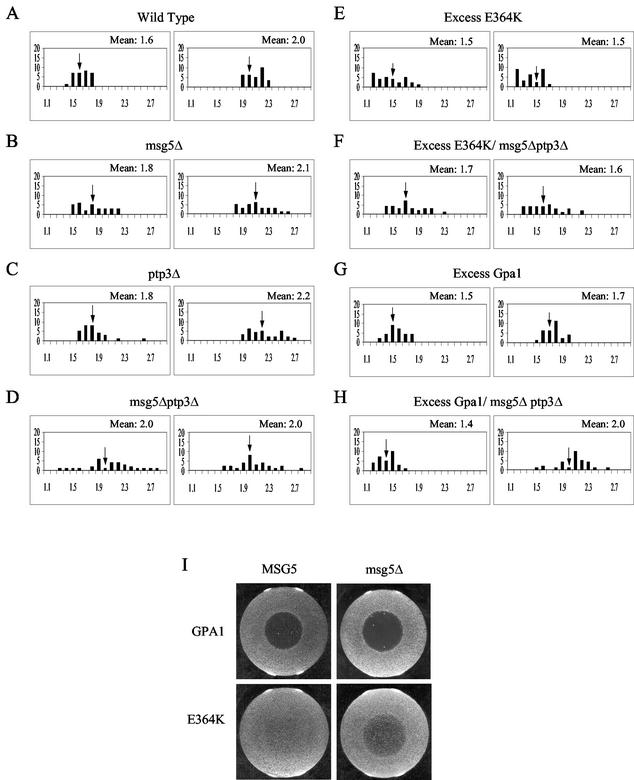
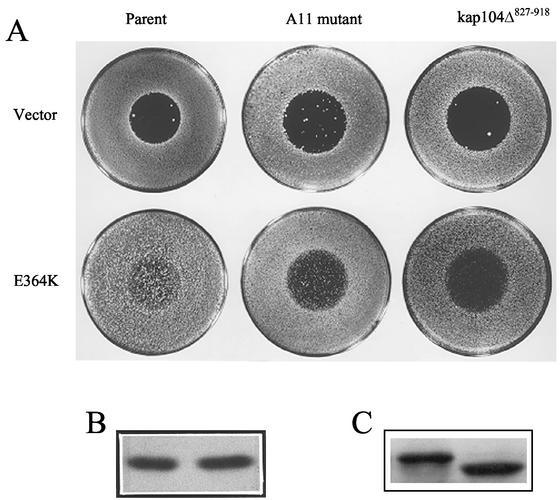
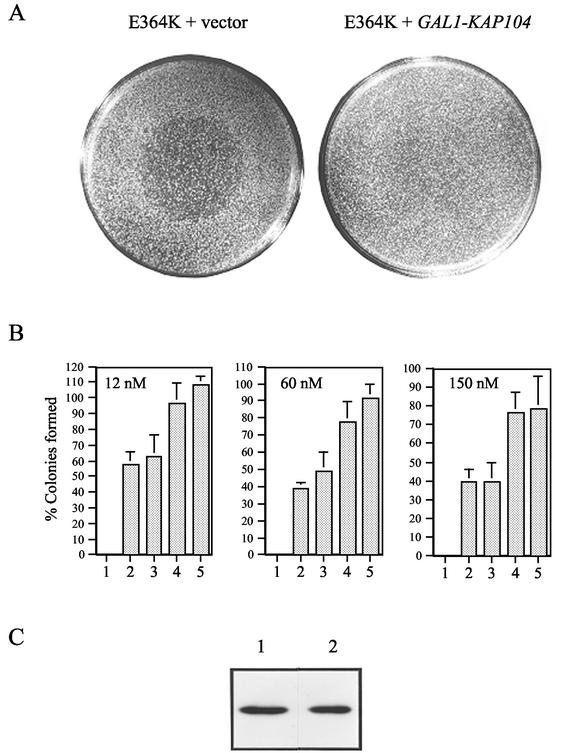
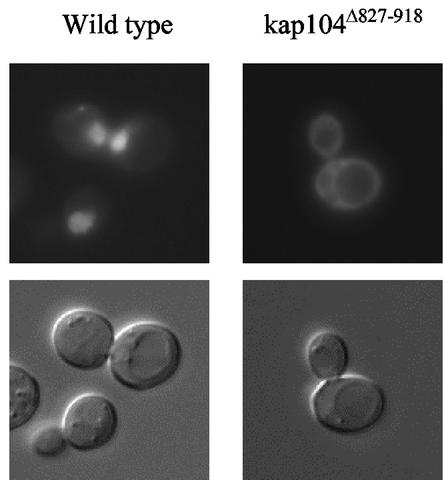
The mating-specific G(alpha) protein of Saccharomyces cerevisiae, Gpa1, stimulates adaptation to pheromone by a mechanism independent of G(beta gamma) sequestration. Genetic evidence suggests that Gpa1 targets the Fus3 mitogen-activated protein kinase, and it has recently been shown that the two proteins interact in cells responding to pheromone. To test the possibility that Gpa1 downregulates the mating signal by affecting the localization of Fus3, we created a Fus3-green fluorescent protein (GFP) fusion protein. In vegetative cells, Fus3-GFP was found in both the cytoplasm and the nucleus. Pheromone stimulated a measurable increase in the ratio of nuclear to cytoplasmic Fus3-GFP. In contrast, the relative level of nuclear Fus3-GFP decreased as cells recovered from pheromone arrest and did not increase when cells adapted to chronic stimulus were challenged again. Accumulation of Fus3-GFP in the nuclei of stimulated cells was also inhibited by overexpression of either wild-type Gpa1, the E364K hyperadaptive mutant form of Gpa1, or the Msg5 dually specific phosphatase. The effects of Gpa1 and Msg5 on Fus3 are partially interdependent. In a genetic screen for adaptive defective mutants, a nonsense allele of the nucleocytoplasmic transport receptor, Kap104, was identified. Truncation of the Kap104 cargo-binding domain blocked the effect of both Gpa1(E364K) and Msg5 on Fus3-GFP localization. Based on these results, we propose that Gpa1 and Msg5 work in concert to downregulate the mating signal and that they do so by inhibiting the pheromone-induced increase of Fus3 in the nucleus. Kap104 is required for the G(alpha)/phosphatase-mediated effect on Fus3 localization.


Figures

FIG. 1.
FIG. 1.
Pheromone induces nuclear accumulation of Fus3. Strains of the indicated genotype were transformed with the indicated GFP reporters and grown to mid-log phase. The cultures were then split and grown with or without the addition of 12 nM α-factor. Images were acquired from the untreated cultures and at various times after the addition of pheromone. The RNCF values were determined as described in Materials and Methods. In panels B to E, distributions of RNCF values are represented in histograms. The number of cells (y axis) are plotted as a function of the RNCF values (x axis). In each panel, the untreated cells are represented in the top histogram, and the cells treated for 3 h with pheromoneare represented in the bottom histogram. Arrows indicate the mean RNCF for each of the sampled populations. (A) Time course experiment showing Fus3-GFP localization in wild-type cells (○), cells overexpressing Gpa1E364K (□), and cells overexpressing Msg5 (⋄). Mean RNCF values were determined before and 10, 20, 40, 60, 90, 120, and 180 min after pheromone treatment; (B) Fus3T180A Y182A-GFP localization in fus3Δ kss1Δ cells; (C) Fus3-GFP localization in fus3Δ kss1Δ cells; (D) Fus3T180A Y182A-GFP localization in fus3Δ cells; (E) Fus3-GFP localization in fus3Δ cells.
FIG. 2.
FIG. 2.
Adaptation to pheromone is correlated with a decrease in nuclear Fus3. Wild-type cells transformed with Fus3-GFP were grown to mid-log phase and treated with 6 nM α-factor. Images were acquired at 0, 3, 6, and 27 h. After 24 h in the original medium, the treated culture was resuspended in fresh medium containing 6 nM α-factor, and images were taken for analysis 3 h later. RNCF values were determined as described in Materials and Methods, and the distribution of values represented in histograms. The number of cells (y axis) are plotted as a function of the RNCF values (x axis). The arrows on the histograms indicate the mean RNCF for each of the sampled populations. The arrows on the DIC images indicate cells that have responded and recovered (budded shmoos). “UB” refers to the percentage of unbudded cells. “S” refers to the percentage of shmooing cells. (A) Vegetative cells; (B) cells 3 h after treatment; (C) cells 6 h after treatment; (D) cells 27 h after first treatment and 3 h after the second treatment.
FIG. 3.
FIG. 3.
Gpa1 and Msg5 inhibit the pheromone-induced accumulation of Fus3 in the nucleus. MATa strains of the indicated genotype were transformed with the Fus3-GFP reporter and grown to mid-log phase in galactose medium (GAL1 promoter on). The cultures were then split and grown with or without the addition of 18 nM α-factor. Images were acquired from the untreated cultures and from the treated cultures 3 h after the addition of pheromone. The RNCF values were determined as described in Materials and Methods, and the distribution of values is represented in histograms. The number of cells (y axis) are plotted as a function of the RNCF values (x axis). In each panel, the untreated cells are represented in the histogram on the left, and the treated cells are represented in the histogram on the right. Arrows indicate the mean RNCF for each of the sampled populations. UB refers to the percentage of unbudded cells; S refers to the percentage of shmooing cells. (A) Wild-type cells; (B) GAL1EG28-GPA1 cells; (C) GAL1EG28-GPA1K21E R22 cells; (D) GAL1-MSG5 cells; (E) GAL1-PTP3 cells; (F) GAL1EG28-GPA1E364K cells; (G) GAL1EG28-GPA1K21E R22E E364K cells; (H) GAL1EG28-GPA1E364K kap104Δ::HIS YCplac111/kap104Δ827-918 cells; (I) YCplac22/GAL1-MSG5 kap104Δ::HIS YCplac111/kap104Δ827-918 cells.
FIG. 4.
FIG. 4.
Fus3 localization in cells lacking MSG5 and/or PTP3. Strains of the indicated genotype were transformed with the Fus3-GFP reporter and grown to mid-log phase in galactose medium (GAL1 promoter on). The cultures were then split and grown with or without the addition of 18 nM α-factor. Images were acquired from the untreated cultures and from the treated cultures 3 h after the addition of pheromone. The RNCF values were determined as described in Materials and Methods, and the distribution of values represented in histograms. The number of cells (y axis) are plotted as a function of the RNCF values (x axis). In each panel, the untreated cells are represented in the histogram on the left, and the treated cells are represented in the histogram on the right. Arrows indicate the mean RNCF for each of the sampled populations. (A) Wild-type cells; (B) msg5Δ cells; (C) ptp3Δ cells; (D) msg5Δ ptp3Δ cells; (E) GAL1EG28-GPA1E364K cells; (F) GAL1EG28-GPA1E364K msg5Δ ptp3Δ cells; (G) YCplac22/GAL1EG28-GPA1 cells; (H) YCplac22/GAL1EG28-GPA1 msg5Δ ptp3Δ cells. (I) Halo tests showing the epistatic effect of msg5Δ on Gpa1E364K-induced adaptation: wild-type cells (top left), msg5Δ cells (top right), YCplac111/Gpa1E364K (61) in wild-type cells (bottom left), and YCplac111/Gpa1E364K in msg5Δ cells (bottom right).
FIG. 5.
FIG. 5.
Effect of Kap104 truncation on pheromone-induced cell cycle arrest. (A) Strains DSY278 and A11 were transformed with YCplac33 (18) (top row) or YCplac33/Gpa1E364K (36) (bottom row). Strain ZW432 (15Dau kap104Δ::URA3/kap104Δ827-918) was transformed with YCplac22 (18) (top row) or YCplac22/Gpa1E364K (62) (bottom row). Transformants were cultured and tested in glucose medium. (B) Immunoblot probed with Gpa1 antibody. Protein was extracted from strains DSY278 (left) and A11 (right), both transformed with YCplac33/Gpa1E364K. (C) Immunoblot probed with Kap104 antibody. Protein was extracted from strain DSY278 (left) and strain A11 (right).
FIG. 6.
FIG. 6.
Overexpression of Kap104 potentiates Gpa1-mediated adaptation. Strain 15Dau was transformed with the vectors indicated below and the transformants were tested for their ability to grow in a range of pheromone concentrations. The transformants were cultured and assayed in galactose medium. (A) Halo tests: YCplac111/Gpa1E364K and pYES (left); YCplac111/Gpa1E364K, and pYES/KAP104 (right). (B) Single-colony formation assays. The ability to form colonies on medium containing discrete concentrations of α-factor was assayed. The numbers plotted are the percentages of cells of a given strain that formed colonies at the indicated dose. Each datum point is the mean of at least two trials with each of at least six transformants. Plasmids pYES/KAP104-A and pYES/KAP104-B were constructed by using DNA derived from two independent PCR amplifications of the KAP104 coding region. Columns: 1, pYES; 2, YCplac111/Gpa1E364K; 3, pYES and YCplac111/Gpa1E364K; 4, pYES/KAP104-A and YCplac111/Gpa1E364K; 5, pYES/KAP104-B and YCplac111/Gpa1E364. (C) Immunoblot probed with Gpa1 antibody. Protein was extracted from strain 15Dau transformed with YCplac111/Gpa1E364K (left) and with pYES/KAP104 and YCplac111/Gpa1E364K (right).
FIG. 7.
FIG. 7.
Effect of kap104Δ827-918 on Nab2-GFP localization. Wild-type and A11 cells transformed with Nab2-GFP were examined in mid-log phase.

References

    1. Aitchison, J. D., G. Blobel, and M. P. Rout. 1996. Kap104p: a karyopherin involved in the nuclear transport of messenger RNA binding proteins. Science 274:624-627. - PubMed
    1. Alani, E., L. Cao, and N. Kleckner. 1987. A method for gene disruption that allows repeated use of URA3 selection in the construction of multiply disrupted yeast strains. Genetics 116:541-545. - PMC - PubMed
    1. Alepuz, P. M., A. Jovanovic, V. Reiser, and G. Ammerer. 2001. Stress-induced MAP kinase Hog1 is part of transcription activation complexes. Mol. Cell 7:767-777. - PubMed
    1. Ausubel, F. M., R. Brent, R. E. Kingston, D. D. Moore, J. G. Seidman, J. A. Smith, and K. Struhl. 1994. Current protocols in molecular biology. John Wiley & Sons, Inc., New York, N.Y.
    1. Cade, R. M., and B. Errede. 1994. MOT2 encodes a negative regulator of gene expression that affects basal expression of pheromone-responsive genes in Saccharomyces cerevisiae. Mol. Cell. Biol. 14:3139-3149. - PMC - PubMed

Publication types

MeSH terms

Substances