. 2003 Feb;23(4):1334-40.
doi: 10.1128/MCB.23.4.1334-1340.2003.

Formation of a tissue-specific histone acetylation pattern by the hematopoietic transcription factor GATA-1

Affiliations

Formation of a tissue-specific histone acetylation pattern by the hematopoietic transcription factor GATA-1

Danielle L Letting et al. Mol Cell Biol. 2003 Feb.

Abstract

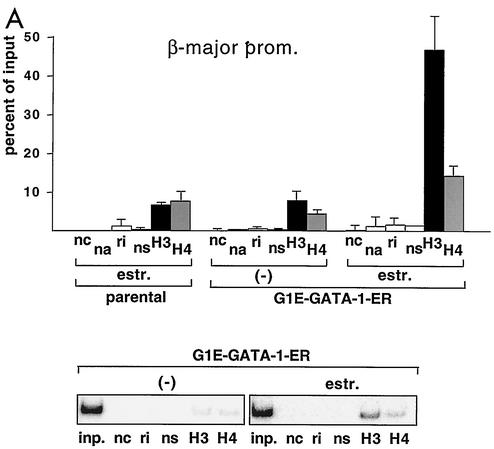
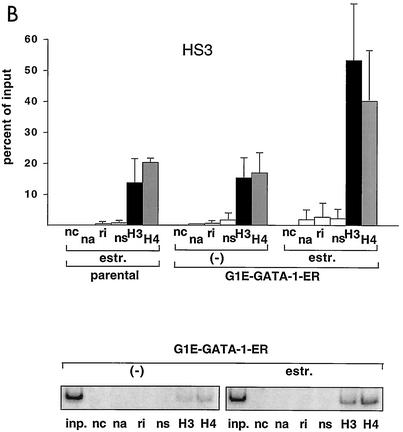
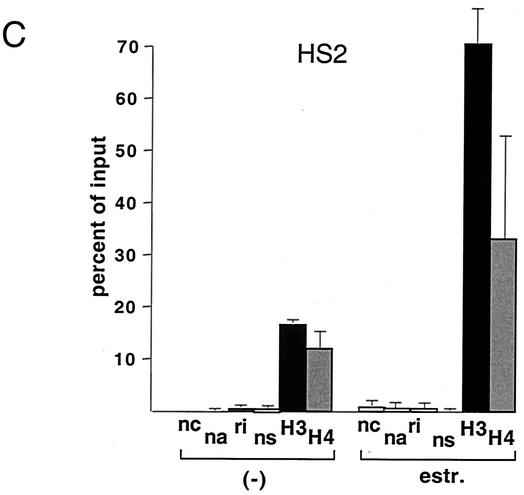
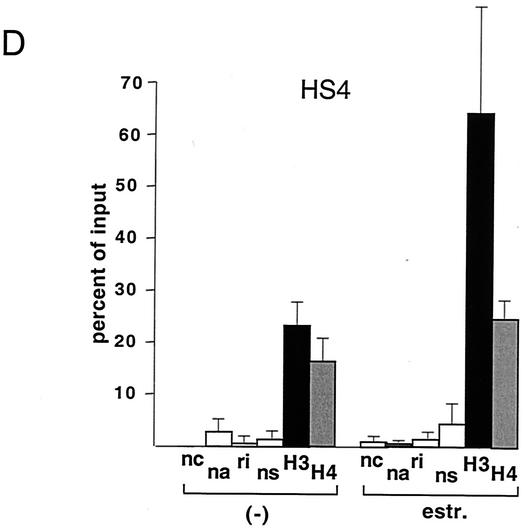
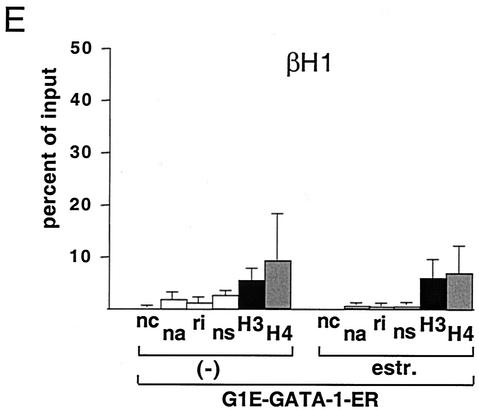
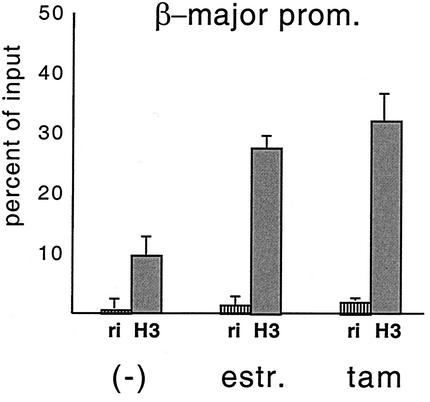
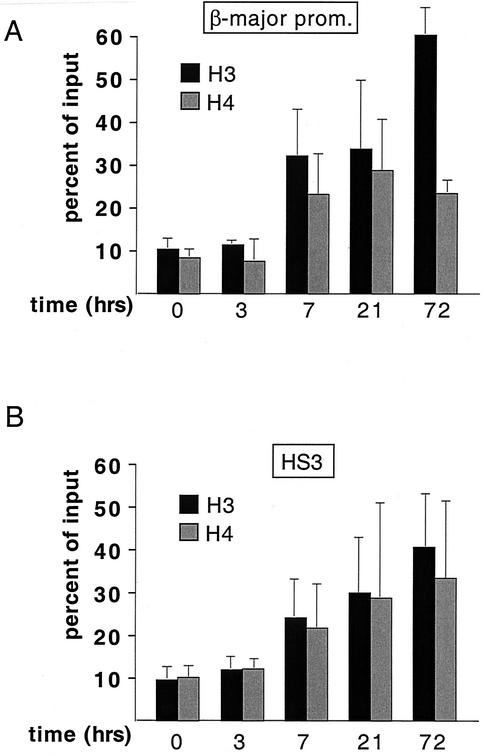
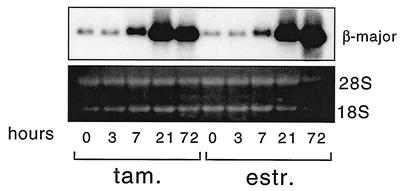
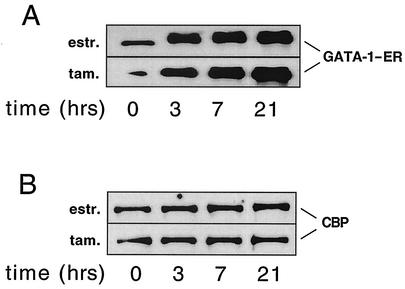
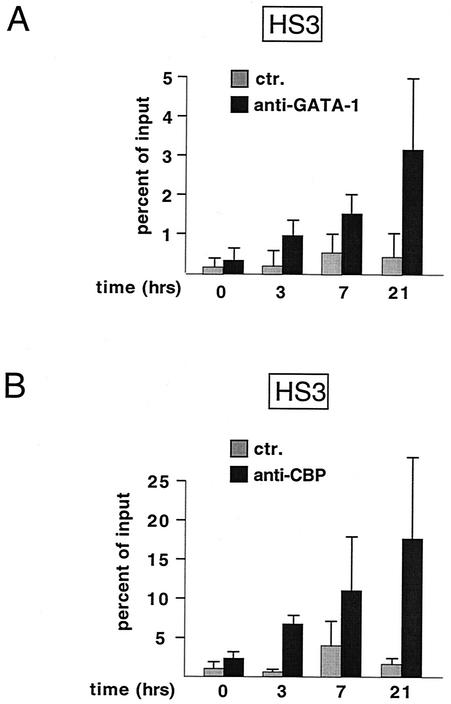
One function of lineage-restricted transcription factors may be to control the formation of tissue-specific chromatin domains. In erythroid cells, the beta-globin gene cluster undergoes developmentally regulated hyperacetylation of histones at the active globin genes and the locus control region (LCR). However, it is unknown which transcription factor(s) governs the establishment of this erythroid-specific chromatin domain. We measured histone acetylation at the beta-globin locus in the erythroid cell line G1E, which is deficient for the essential hematopoietic transcription factor GATA-1. Restoration of GATA-1 activity in G1E cells led to a substantial increase in acetylation of histones H3 and H4 at the beta-globin promoter and the LCR. Time course experiments showed that histone acetylation occurred rapidly after GATA-1 activation and coincided with globin gene expression, indicating that the effects of GATA-1 are direct. Moreover, increases in histone acetylation correlated with occupancy of GATA-1 and the acetyltransferase CBP at the locus in vivo. Together, these results suggest that GATA-1 and its cofactor CBP are essential for the formation of an erythroid-specific acetylation pattern that is permissive for high levels of gene expression.


Figures

FIG. 1.
FIG. 1.
GATA-1-ER stimulates histone acetylation at the β-major globin gene promoter and the LCR. (A) ChIP assay using anti-diacetyl H3 and anti-tetraacetyl H4 antibodies. PCR primers span the β-major globin gene promoter region (see Table 1). Parental G1E cells lacking GATA-1-ER were treated with estradiol (estr.) for 72 h. G1E GATA-1-ER cells were left untreated (−) or were treated with estradiol for 72 h. Results are plotted as the percentage of nonprecipitated chromatin (input). Controls include no chromatin (nc), no antibody (na), rabbit nonimmune immunoglobulin G (ri), and rabbit nonimmune serum (ns). Results are averages of eight independent experiments. Error bars indicate standard deviations. The bottom panel is a representative polyacrylamide gel showing PCR products. (B) ChIP experiments using primers for HS3. Controls are as in panel A. Averages of six independent experiments are shown. Bottom panel: representative polyacrylamide gel showing PCR products. (C and D) Same experiment as shown in panel B, except that primers for HS2 and HS4 were used, respectively. Results are averages of three independent experiments. (E) Analysis of histone H3 and H4 acetylation at the embryonic βH1 globin gene. Results are averages of three independent experiments.
FIG. 1.
FIG. 1.
GATA-1-ER stimulates histone acetylation at the β-major globin gene promoter and the LCR. (A) ChIP assay using anti-diacetyl H3 and anti-tetraacetyl H4 antibodies. PCR primers span the β-major globin gene promoter region (see Table 1). Parental G1E cells lacking GATA-1-ER were treated with estradiol (estr.) for 72 h. G1E GATA-1-ER cells were left untreated (−) or were treated with estradiol for 72 h. Results are plotted as the percentage of nonprecipitated chromatin (input). Controls include no chromatin (nc), no antibody (na), rabbit nonimmune immunoglobulin G (ri), and rabbit nonimmune serum (ns). Results are averages of eight independent experiments. Error bars indicate standard deviations. The bottom panel is a representative polyacrylamide gel showing PCR products. (B) ChIP experiments using primers for HS3. Controls are as in panel A. Averages of six independent experiments are shown. Bottom panel: representative polyacrylamide gel showing PCR products. (C and D) Same experiment as shown in panel B, except that primers for HS2 and HS4 were used, respectively. Results are averages of three independent experiments. (E) Analysis of histone H3 and H4 acetylation at the embryonic βH1 globin gene. Results are averages of three independent experiments.
FIG. 2.
FIG. 2.
Tamoxifen and estradiol treatment of G1E GATA-1-ER cells for 72 h elicits comparable increases in histone H3 acetylation at the β-major promoter. The mean values of two independent experiments are shown.
FIG. 3.
FIG. 3.
Stimulation of histone H3 and H4 acetylation rapidly follows activation of GATA-1-ER at the β-major promoter (A) and HS3 (B). Cells were treated with estradiol for the indicated amounts of time. The results are averages of three independent experiments.
FIG. 4.
FIG. 4.
Northern analysis of RNA derived from G1E GATA-1-ER cells treated with estradiol (estr.) and tamoxifen (tam.) for the indicated number of hours. Blots were probed with β-major globin cDNA. 28S and 18S rRNAs are shown to indicate equal amounts of RNA loading.
FIG. 5.
FIG. 5.
Nuclear extracts from cells treated with estradiol for the indicated amounts of time were analyzed by Western blotting with anti-GATA-1 (A) and anti-CBP (B) antibodies.
FIG. 6.
FIG. 6.
GATA-1 occupancy correlates with CBP occupancy at HS3. ChIP analysis of G1E GATA-1-ER cells at indicated time points following estradiol treatment using anti-GATA-1 (A) and anti-CBP (B) antibodies. Note that the presence of GATA-1 and CBP at HS3 precedes increases in histone acetylation (compare with Fig. 3). The results at each time point are the mean of at least three independent experiments.

Similar articles

Cited by

References

    1. Anguita, E., C. A. Johnson, W. G. Wood, B. M. Turner, and D. R. Higgs. 2001. Identification of a conserved erythroid specific domain of histone acetylation across the alpha-globin gene cluster. Proc. Natl. Acad. Sci. USA 98:12114-12119. - PMC - PubMed
    1. Bender, M. A., M. Bulger, J. Close, and M. Groudine. 2000. Beta-globin gene switching and DNase I sensitivity of the endogenous beta-globin locus in mice do not require the locus control region. Mol. Cell 5:387-393. - PubMed
    1. Blobel, G. A. 2000. CBP/p300: molecular integrators of hematopoietic transcription. Blood 95:745-755. - PubMed
    1. Blobel, G. A., T. Nakajima, R. Eckner, M. Montminy, and S. H. Orkin. 1998. CREB-binding protein (CBP) cooperates with transcription factor GATA-1 and is required for erythroid differentiation. Proc. Natl. Acad. Sci. USA 95:2061-2066. - PMC - PubMed
    1. Bulger, M., T. Sawado, D. Schubeler, and M. Groudine. 2002. ChIPs of the beta-globin locus: unraveling gene regulation within an active domain. Curr. Opin. Genet. Dev. 12:170-177. - PubMed

Publication types

MeSH terms

LinkOut - more resources