Complex dynamic processes in sign tracking with an omission contingency (negative automaintenance)
- PMID: 12561133
- PMCID: PMC2643130
- DOI: 10.1037/0097-7403.29.1.49
Complex dynamic processes in sign tracking with an omission contingency (negative automaintenance)
Abstract
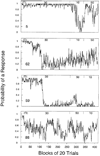
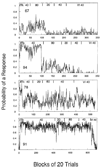
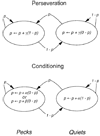
Hungry pigeons received food periodically, signaled by the onset of a keylight. Key pecks aborted the feeding. Subjects responded for thousands of trials, despite the contingent nonreinforcement, with varying probability as the intertrial interval was varied. Hazard functions showed the dominant tendency to be perseveration in responding and not responding. Once perseveration was accounted for, a linear operator model of associative conditioning further improved predictions. Response rates during trials were correlated with the prior probabilities of a response. Rescaled range analyses showed that the behavioral trajectories were a kind of fractional Brownian motion.
Figures


Similar articles
-
Negative automaintenance omission training is effective.J Exp Anal Behav. 2006 Jul;86(1):1-10. doi: 10.1901/jeab.2006.36-05. J Exp Anal Behav. 2006. PMID: 16903489 Free PMC article.
-
The dynamics of conditioning and extinction.J Exp Psychol Anim Behav Process. 2009 Oct;35(4):447-72. doi: 10.1037/a0015626. J Exp Psychol Anim Behav Process. 2009. PMID: 19839699 Free PMC article.
-
Resistance to change and frequency of response-dependent stimuli uncorrelated with reinforcement.J Exp Anal Behav. 2009 Sep;92(2):199-214. doi: 10.1901/jeab.2009.92-199. J Exp Anal Behav. 2009. PMID: 20354599 Free PMC article.
-
Differences in rats and pigeons suboptimal choice may depend on where those stimuli are in their behavior system.Behav Processes. 2019 Feb;159:37-41. doi: 10.1016/j.beproc.2018.11.012. Epub 2018 Dec 6. Behav Processes. 2019. PMID: 30529687 Review.
-
Feeding behavior of Aplysia: a model system for comparing cellular mechanisms of classical and operant conditioning.Learn Mem. 2006 Nov-Dec;13(6):669-80. doi: 10.1101/lm.339206. Learn Mem. 2006. PMID: 17142299 Review.
Cited by
-
Implicit learning in cotton-top tamarins (Saguinus oedipus) and pigeons (Columba livia).Learn Behav. 2015 Jun;43(2):129-42. doi: 10.3758/s13420-015-0167-0. Learn Behav. 2015. PMID: 25673101
-
Accounting for negative automaintenance in pigeons: a dual learning systems approach and factored representations.PLoS One. 2014 Oct 27;9(10):e111050. doi: 10.1371/journal.pone.0111050. eCollection 2014. PLoS One. 2014. PMID: 25347531 Free PMC article.
-
Indicators of early and late processing reveal the importance of within-trial-time for theories of associative learning.PLoS One. 2013 Jun 24;8(6):e66291. doi: 10.1371/journal.pone.0066291. Print 2013. PLoS One. 2013. PMID: 23826092 Free PMC article.
-
Stimulus-food pairings produce stimulus-directed touch-screen responding in cynomolgus monkeys (macaca fascicularis) with or without a positive response contingency.J Exp Anal Behav. 2009 Jul;92(1):41-55. doi: 10.1901/jeab.2009.92-41. J Exp Anal Behav. 2009. PMID: 20119521 Free PMC article.
-
Rapid acquisition in concurrent chains: evidence for a decision model.J Exp Anal Behav. 2006 Mar;85(2):181-202. doi: 10.1901/jeab.2006.72-04. J Exp Anal Behav. 2006. PMID: 16673825 Free PMC article.
References
-
- Atkinson RC, Bower GH, Crothers EJ. An introduction to mathematical learning theory. New York: Wiley; 1965.
-
- Balsam PD, Tomie A. Context and learning. Hillsdale, NJ: Erlbaum; 1985.
-
- Bowe CA, Green L, Miller JD. Differential acquisition of discriminated autoshaping as a function of stimulus qualities and locations. Animal Learning &Behavior. 1987;15:285–292.

