

Matrix volume measurements challenge the existence of diazoxide/glibencamide-sensitive KATP channels in rat mitochondria
- PMID: 12562892
- PMCID: PMC2342718
- DOI: 10.1113/jphysiol.2002.035006
Matrix volume measurements challenge the existence of diazoxide/glibencamide-sensitive KATP channels in rat mitochondria
Abstract
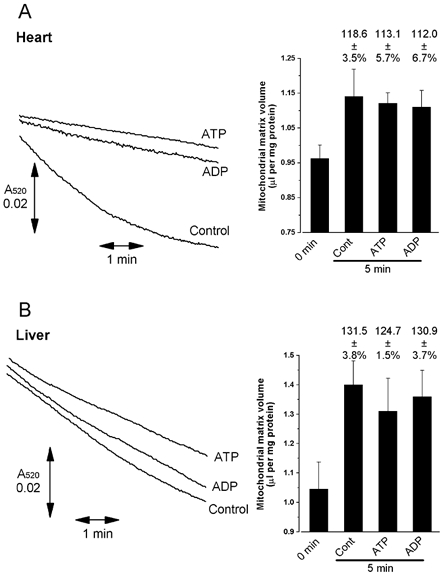
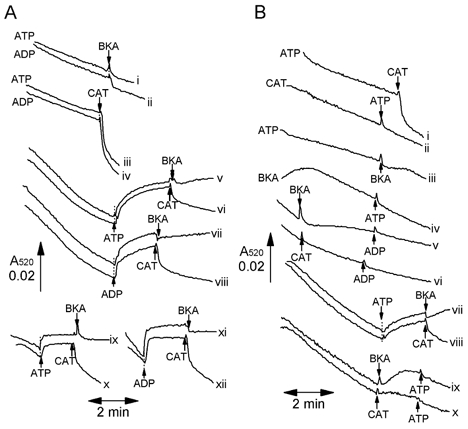
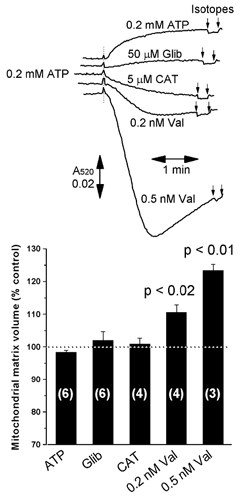
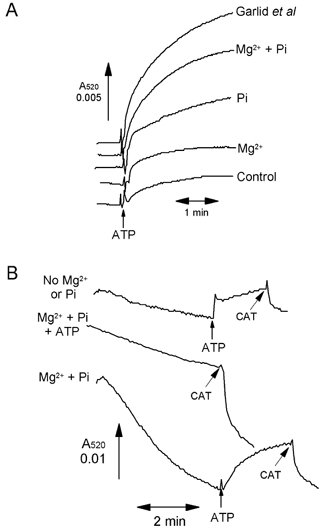
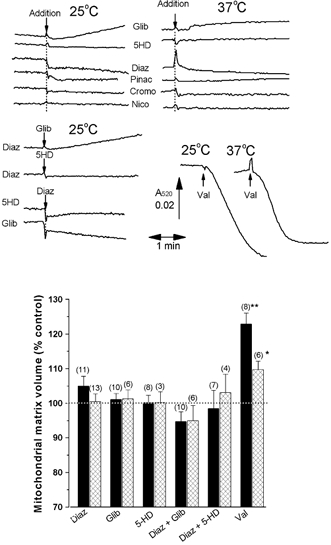
A mitochondrial sulphonylurea-sensitive, ATP-sensitive K+ channel (mitoKATP) that is selectively inhibited by 5-hydroxydecanoate (5-HD) and activated by diazoxide has been implicated in ischaemic preconditioning. Here we re-evaluate the evidence for the existence of this mitoKATP by measuring changes in light scattering (A520) in parallel with direct determination of mitochondrial matrix volumes using 3H2O and [14C]sucrose. Incubation of rat liver and heart mitochondria in KCl medium containing Mg2+ and inorganic phosphate caused a decrease in light scattering over 5 min, which was accompanied by a small (15-30 %) increase in matrix volume. The presence of ATP or ADP in the buffer from the start greatly inhibited the decline in A520, whilst addition after a period of incubation (1-5 min) induced a rapid increase in A520, especially in heart mitochondria. Neither response was accompanied by a change in matrix volume, as measured isotopically. However, the effects of ATP and ADP on A520 were abolished by carboxyatractyloside and bongkrekic acid, inhibitors of the adenine nucleotide translocase (ANT) that lock the transporter in two discrete conformations and cause distinct changes in A520 in their own right. These data suggest that rather than matrix volume changes, the effects of ATP and ADP on A520 reflect changes in mitochondrial shape induced by conformational changes in the ANT. Furthermore, we were unable to demonstrate either a decrease in A520 or increase in matrix volume with a range of ATP-sensitive K+ channel openers such as diazoxide. Nor did glibencamide or 5-HD cause any reduction of matrix volume, whereas the K+ ionophore valinomycin (0.2 nM), produced a 10-20 % increase in matrix volume that was readily detectable by both techniques. Our data argue against the existence of a sulphonylurea-inhibitable mitoKATP channel.
Figures
Similar articles
-
Lack of manifestations of diazoxide/5-hydroxydecanoate-sensitive KATP channel in rat brain nonsynaptosomal mitochondria.J Physiol. 2005 Oct 1;568(Pt 1):47-59. doi: 10.1113/jphysiol.2005.091199. Epub 2005 Jul 28. J Physiol. 2005. PMID: 16051627 Free PMC article.
-
Pharmacological and histochemical distinctions between molecularly defined sarcolemmal KATP channels and native cardiac mitochondrial KATP channels.Mol Pharmacol. 1999 Jun;55(6):1000-5. Mol Pharmacol. 1999. PMID: 10347240
-
Bioenergetic and volume regulatory effects of mitoKATP channel modulators protect against hypoxia-reoxygenation-induced mitochondrial dysfunction.J Exp Biol. 2016 Sep 1;219(Pt 17):2743-51. doi: 10.1242/jeb.140186. Epub 2016 Jun 29. J Exp Biol. 2016. PMID: 27358470
-
Mitochondria: a new target for K channel openers?Trends Pharmacol Sci. 1999 Apr;20(4):157-61. doi: 10.1016/s0165-6147(99)01301-2. Trends Pharmacol Sci. 1999. PMID: 10322501 Review.
-
ATP-regulated K+ channel in mitochondria: pharmacology and function.J Bioenerg Biomembr. 1996 Apr;28(2):147-52. doi: 10.1007/BF02110645. J Bioenerg Biomembr. 1996. PMID: 9132413 Review.
Cited by
-
Mitochondrial cytochrome c release may occur by volume-dependent mechanisms not involving permeability transition.Biochem J. 2004 Feb 15;378(Pt 1):213-7. doi: 10.1042/BJ20031193. Biochem J. 2004. PMID: 14629197 Free PMC article.
-
Beating oxygen: chronic anoxia exposure reduces mitochondrial F1FO-ATPase activity in turtle (Trachemys scripta) heart.J Exp Biol. 2013 Sep 1;216(Pt 17):3283-93. doi: 10.1242/jeb.087155. J Exp Biol. 2013. PMID: 23926310 Free PMC article.
-
Diazoxide protects against doxorubicin-induced cardiotoxicity in the rat.BMC Pharmacol Toxicol. 2014 May 27;15:28. doi: 10.1186/2050-6511-15-28. BMC Pharmacol Toxicol. 2014. PMID: 24887454 Free PMC article.
-
The C. elegans mitochondrial K+(ATP) channel: a potential target for preconditioning.Biochem Biophys Res Commun. 2008 Nov 21;376(3):625-8. doi: 10.1016/j.bbrc.2008.09.043. Epub 2008 Sep 20. Biochem Biophys Res Commun. 2008. PMID: 18809388 Free PMC article.
-
Endogenous and Agonist-induced Opening of Mitochondrial Big Versus Small Ca2+-sensitive K+ Channels on Cardiac Cell and Mitochondrial Protection.J Cardiovasc Pharmacol. 2017 Nov;70(5):314-328. doi: 10.1097/FJC.0000000000000524. J Cardiovasc Pharmacol. 2017. PMID: 28777255 Free PMC article.
References
-
- Asimakis GK, Conti VR. Phosphate-induced efflux of adenine nucleotides from heart mitochondria. Am J Physiol. 1985;249:H1009–1016. - PubMed
-
- Baines CP, Cohen MV, Downey JM. Signal transduction in ischemic preconditioning: The role of kinases and mitochondrial K-ATP channels. J Cardiovasc Electrophysiol. 1999;10:741–754. - PubMed
-
- Baines CP, Goto M, Downey JM. Oxygen radicals released during ischemic preconditioning contribute to cardioprotection in the rabbit myocardium. J Mol Cell Cardiol. 1997;29:207–216. - PubMed
-
- Bajgar R, Seetharaman S, Kowaltowski AJ, Garlid KD, Paucek P. Identification and properties of a novel intracellular (mitochondrial) ATP-sensitive potassium channel in brain. J Biol Chem. 2001;276:33369–33374. - PubMed
-
- Beavis AD, Brannan RD, Garlid KD. Swelling and contraction of the mitochondrial matrix. 1. A structural interpretation of the relationship between light scattering and mitochondrial volume. J Biol Chem. 1985;260:1324–13433. - PubMed
Publication types
MeSH terms
Substances
LinkOut - more resources
Full Text Sources
Medical