. 2003 Feb 15;547(Pt 1):181-96.
doi: 10.1113/jphysiol.2002.033688. Epub 2003 Jan 10.

Multiple conductance states of single Ca2+-activated Cl- channels in rabbit pulmonary artery smooth muscle cells

Affiliations

Multiple conductance states of single Ca2+-activated Cl- channels in rabbit pulmonary artery smooth muscle cells

A S Piper et al. J Physiol. .

Abstract

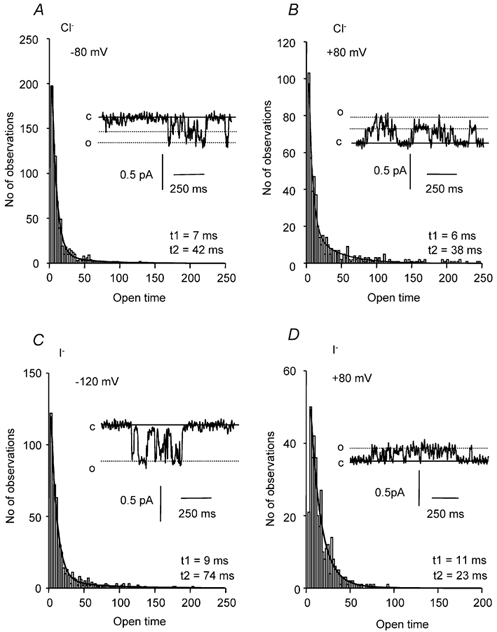
Ca2+-activated Cl- channels contribute to agonist-evoked contraction and spontaneous activity in some smooth muscle preparations. Patch pipette techniques were used to study the properties of single Ca2+-activated Cl- channels in freshly dispersed rabbit pulmonary artery myocytes. In the cell-attached recording mode, two conductance states of 3.5 and 1.8 pS were recorded either spontaneously or in response to increasing [Ca2+]i. With inside-out patches, the 3.5 pS channel current predominated at 50 nM [Ca2+]i, but at 500 nM [Ca2+]i most channels opened to the 1.8 pS level and an additional 1.2 pS channel conductance was resolved. At 1 microM [Ca2+]i all of the Cl- channels opened either to the 1.8 pS or 1.2 pS level. In 0 [Ca2+]i, no channel activity was observed at -100 mV to +100 mV, but with 10-250 nM [Ca2+]i the total single channel open probability (NP(o)) increased with depolarisation. This voltage dependence was not seen at higher values of [Ca2+]i. The plot of NPo vs. [Ca2+]i yielded Ca2+ affinity constants of 8 and 250 nM and Hill slopes of 1.3 and 2.3 at +100 and -100 mV, respectively. The distribution of open times was fitted by two exponentials of about 5 and 30 ms, which were neither voltage nor Ca2+ dependent. Replacement of external Cl- by I- shifted the reversal potential by about -30 mV and lengthened the longer of the two mean open times without significant effects on other kinetic parameters. Based on these data, a model for the activation of Ca2+-activated Cl- channels is proposed.


Figures

Figure 1
Figure 1. Single Ca2+-activated Cl channel currents recorded in a cell-attached patch
A, current recorded at patch potentials between +80 mV and −80 mV at rest, and 1–5 min after caffeine (5 mm) was applied to the cell. Continuous lines represent the closed channel current level (c), while the dotted lines denote the open channel level for up to four active channels. B, trace of spontaneous single channel currents recorded from a second cell-attached patch with a patch potential of −80 mV. The continuous line represents the closed channel level (c), while the dotted lines represent a channel subconductance level (s) and full conductance level (f). In this and subsequent figures, the current traces have been reversed such that inward currents appear as a downward deflection and outward currents as an upward deflection.
Figure 2
Figure 2. Single Ca2+-activated Cl channel currents recorded in a cell-attached patch in the presence of external I
A, currents recorded at patch potentials between +80 mV and −80 mV when I (choline iodide) replaced Cl in the pipette solution. Continuous lines represent the closed channel level (c), while the dotted line represents the open channel current level. B, mean single channel current-voltage (I-V) curve in the presence of external Cl (▪; n = 6) and external I (○n = 7). The points have been fitted by a straight line and the slope gives an estimated mean conductance of 2.4 pS with both Cl and I pipette solutions. Data are presented as means ± s.e.m.
Figure 3
Figure 3. Single Ca2+-activated Cl channel currents recorded in inside-out patches
A, trace of a single channel current recorded at +100 mV and −100 mV from an inside-out patch with 50 nm [Ca2+]i. The continuous line denotes the closed channel level (c), while the dotted line represents the open channel level. B, single Ca2+-activated Cl channel currents recorded with 250 nm [Ca2+]i at +100 mV and −100 mV. As in A, the continuous line represents the closed channel level (c), while the dotted lines represent the channel subconductance and full conductance current level. C, a section of trace indicated in B is shown at a greater gain. The continuous line denotes the closed channel current level, while dotted lines through the trace show the single channel subconductance and full conductance current level (1.8 and 3.4 pS, respectively). D, single channel currents recorded at +100 and −100 mV from an inside-out patch with 1 µm [Ca2+]i. E, sections of the trace in D are shown at a greater gain. The continuous line represents the closed channel current level, while dotted lines through the trace denote the single channel subconductance level as well as a second smaller subconductance level (1.8 and 1.2 pS, respectively). F, the overall mean single channel I-V curve with 50 nm [Ca2+]i (□; n = 8), 250 nm [Ca2+]i (•; n = 10) and 1 µm [Ca2+]i (▴; n = 7). For each value of [Ca2+]i, the points were fitted by a straight line, the slope of which gives an estimated conductance of 3.0, 2.4 and 1.5 pS with 50 nm, 250 nm and 1 µm [Ca2+]i, respectively.
Figure 4
Figure 4. Effect of [Ca2+]i on the proportion of full and subconductance openings of single Ca2+-activated Cl channels in inside-out patches
Aa, a trace of single channel current recorded at +100 mV with 50 nm [Ca2+]i. The continuous line represents the closed channel level (c), while the dotted line denotes the full conductance level (f). Shown in Ab is an all-points histogram taken from the current trace shown in a. The bin width is 0.01 pA and the data were fitted by the sum of two Gaussian curves, with means of 0 and 0.27 pA. Ba, a trace recorded when the same patch was exposed to 500 nm [Ca2+]i. The continuous line denotes the closed channel level (c), while the dotted lines represent the channel subconductance (s) and full conductance levels (f). Shown in Bb is an all-points histogram taken from the current trace shown in a. The data were fitted by the sum of three Gaussian curves, with means of 0, 0.16 and 0.27 pA; the bin width is 0.01 pA. C, bar chart showing the percentage of subconductance (sub) and full conductance (full) channel openings at +100 mV for [Ca2+]i between 50 nm and 500 nm. Data are presented as means ± s.e.m., n = 8-10. **P < 0.01 and ***P < 0.001, unpaired t test.
Figure 5
Figure 5. Ca2+- and voltage dependence of Ca2+-activated Cl channels in inside-out patches
A, total single channel open probability (NPo) at +100 and −100 mV for values of [Ca2+]i between 10 nm and 1 µm. B, plot of NPovs.[Ca2+]i at patch potentials between +100 mV and −100 mV. Data at each voltage were fitted by the Hill equation to give the apparent dissociation constant (Kd) and the Hill coefficient (nH). C, Kd values obtained from B plotted against patch potential. D, plot of nH values from B vs. patch potential. The data points in both C and D were fitted by a straight line. Data are presented as the means ± s.e.m., n = 4-10. *P < 0.05, **P < 0.01 and ***P < 0.001; unpaired t test.
Figure 6
Figure 6. Open time distributions of Ca2+-activated Cl channel currents in inside-out patches
A and B, single channel current open time distribution recorded at −100 and +100 mV, respectively, with 50 nm [Ca2+]i. The data could be fitted by the sum of two exponential functions with time constants, t1 and t2, of about 7 and 30 ms, respectively. Inset are sections of current traces that were used to compute the open time histogram. C and D, the single channel current open time distributions from a another inside-out patch at −100 and +100 mV, respectively, with 500 nm [Ca2+]i. The data were fitted by the sum of two exponential functions with time constants, t1 and t2, of about 6 and 34–39 ms, respectively. Insets are sections of the current traces that were used to compute the open time histogram. In A-D the bin width is 2.5 ms and, for each of the current trace insets in A-D, the continuous line denotes the closed channel level (c), while the dotted lines represent the single channel subconductance and full conductance current levels.
Figure 7
Figure 7. Effect of external I on open time distributions for Ca2+-activated Cl channel currents in cell-attached patches
A and B, single channel current open time distribution recorded at −80 and +80 mV with a Cl-containing pipette solution. The data could be fitted by the sum of two exponential functions with time constants, t1 and t2, of about 7 and 38–42 ms, respectively. Insets are sections of the current traces that were used to compute the open time histogram. C, the single channel current open time distribution from a cell-attached patch at −120 mV recorded with an I-containing pipette solution. The data were fitted by the sum of two exponential functions with time constants, t1 and t2, of 9 and 74 ms, respectively. The inset is a section of the current trace that was used to compute the open time histogram. D, single channel current open time distribution from the same cell-attached patch at +80 mV. The data could be fitted by the sum of two exponential functions with time constants, t1 and t2, of 11 and 23 ms, respectively. In A-D the bin width is 2.5 ms and for each of the current trace insets in A-D, the continuous line denotes the closed channel level (c), while the dotted lines represent the open levels of the single channel subconductance and full conductance current states.
Figure 8
Figure 8. Closed time distributions of Ca2+-activated Cl channel currents in inside-out patches
A, single channel current closed time distribution recorded at −100 mV with 100 nm [Ca2+]i. The data could be fitted by the sum of three exponential functions with time constants, t1, t2 and t3, of 3, 15 and 112 ms, respectively. B, single channel current open time distribution from the same patch as A at +100 mV. The closed times could be fitted by the sum of three exponential functions, with time constants, t1, t2 and t3, of 3, 42 and 115 ms, respectively. The bin width in both A and B is 5 ms.
None

References

    1. Arreola J, Melvin JE, Begenisich T. Activation of calcium-dependent chloride channels in rat parotid acinar cells. J Gen Physiol. 1996;108:35–47. - PMC - PubMed
    1. Casteels R, Kitamura DV, Kuriyama H, Suzuki H. The membrane properties of the smooth muscle cells of the rabbit main pulmonary artery. J Physiol. 1977;271:41–61. - PMC - PubMed
    1. Collier ML, Levesque PC, Kenyon JL, Hume JR. Unitary Cl− channels activated by cytoplasmic Ca2+ in canine ventricular myocytes. Circ Res. 1996;78:936–944. - PubMed
    1. Greenwood IA, Large WA. Modulation of the decay of Ca2+-activated Cl− currents in rabbit portal vein smooth muscle cells by external anions. J Physiol. 1999;516:365–376. - PMC - PubMed
    1. Greenwood IA, Ledoux J, Leblanc N. Differential regulation of Ca2+-activated Cl− currents in rabbit arterial and portal vein smooth muscle cells by Ca2+-calmodulin-dependent kinase. J Physiol. 2001;534:395–408. - PMC - PubMed

Publication types

LinkOut - more resources