. 2003 Feb 15;547(Pt 1):255-69.
doi: 10.1113/jphysiol.2002.035857. Epub 2003 Jan 3.

An inwardly rectifying K+ channel in bovine parotid acinar cells: possible involvement of Kir2.1

Affiliations

An inwardly rectifying K+ channel in bovine parotid acinar cells: possible involvement of Kir2.1

M Hayashi et al. J Physiol. .

Erratum in

  • J Physiol. 2003 Mar 15;547(Pt 3):995

Abstract

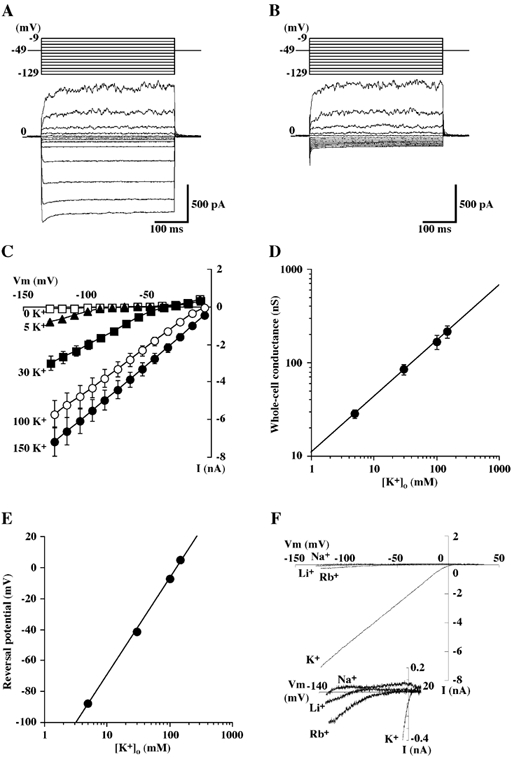
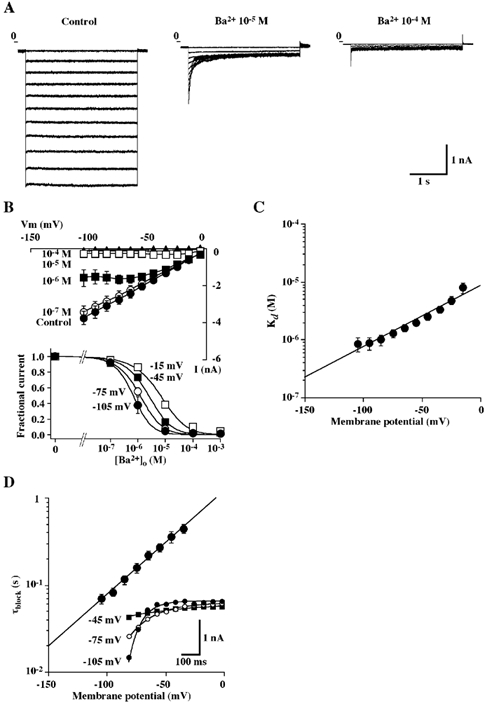
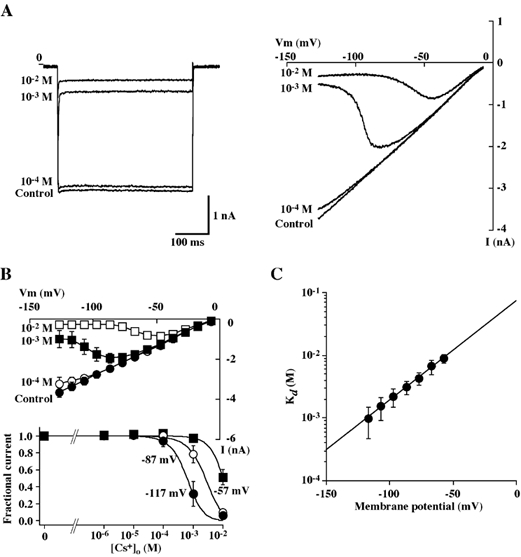
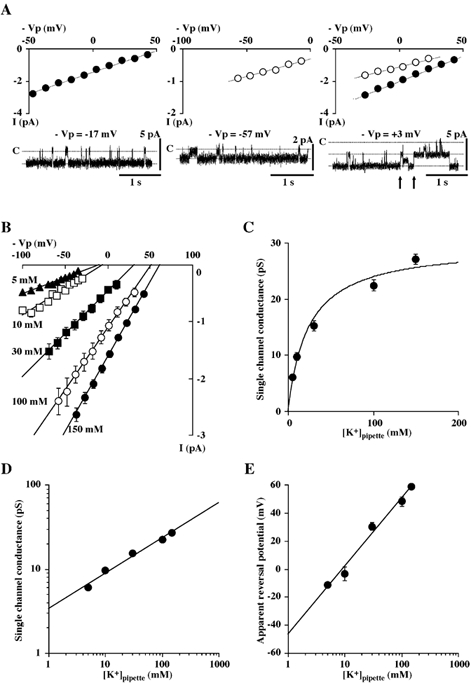
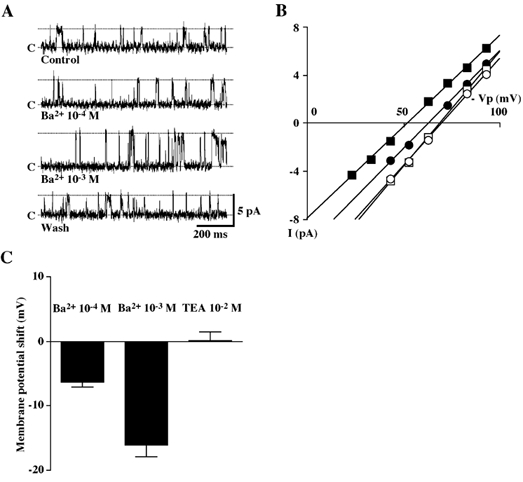
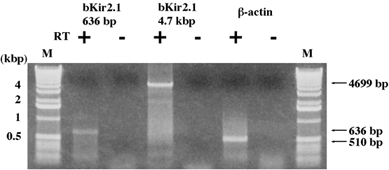
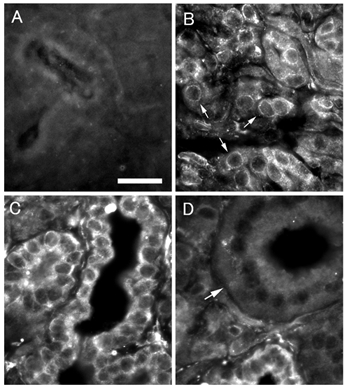
Using electrophysiological and molecular techniques, we investigated the molecular nature of an inwardly rectifying K+ channel in bovine parotid acinar (BPA) cells and examined its role in setting resting membrane potential. In whole-cell recordings from freshly isolated BPA cells, a predominant current was a K+ current rectified strongly in the inward direction. An inward conductance of the inwardly rectifying K+ (Kir) current was proportional to [K+]o(0.57). The selectivity sequence based on permeability ratios was K+ (1.00) > Rb+ (0.63) >> Li+ (0.04) = Na+ (0.02) and the sequence based on conductance ratios was K+ (1.00) >> Rb+ (0.03) = Li+ (0.03) = Na+ (0.02). The current was blocked by extracellular Ba2+ and Cs+ in a voltage- and a concentration-dependent manner, with a Kd at 0 mV of 11.6 microM and 121 mM, respectively. Cell-attached patch measurements identified 27 pS K+ channels as being the most likely to mediate whole-cell Kir currents. Addition of Ba2+ (100 microM) to the bathing solution reversibly depolarized the resting membrane potential in intact unstimulated cells. RT-PCR of RNA from bovine parotid cells revealed transcripts of bovine Kir2.1 (bKir2.1). HEK293 cells stably expressing bKir2.1 cloned from bovine parotid exhibited whole-cell and single channel Kir currents, of which electrophysiological characteristics were quantitatively similar to those of native Kir currents. Immunohistochemical studies showed a bKir2.1 immunoreactivity in BPA cells. Collectively, these results suggest that Kir2.1 may mediate native Kir currents responsible for setting resting membrane potential in BPA cells and might be, at least in part, involved in spontaneous secretion in ruminant parotid glands.


Figures

Figure 1
Figure 1. Dependence of inwardly rectifying currents on extracellular K+ concentration
A and B, representative tracings of whole-cell currents obtained from a single bovine parotid acinar (BPA) cells in the presence (A) and the absence (B) of 5 mm K+ (solution B). Hyperpolarizing and depolarizing pulses 400 ms in duration were applied from a holding potential of −49 mV to potentials between −129 and −9 mV in 10 mV intervals. The pipette was filled with a potassium glutamate-rich solution (solution A). C, steady state current-voltage (I-V) relationships of whole-cell currents recorded from BPA cells bathed in different extracellular K+ concentrations. Each point represents the mean ± s.e.m. of 13 experiments. D, log-log plot of the conductance of the inward current as a function of the extracellular K+ concentration; the line is the line of best fit and the data are from C. E, semi-logarithmic plot of the reversal potential of the inward current as a function of extracellular K+ concentration. Each point represents the mean ± s.e.m., but when this was so small as to lie within the symbols, it has been omitted; the line is the line of best fit and the data are from C. F, representative instantaneous I-V relations of whole-cell currents obtained from single BPA cell with Na+, Li+ or Rb+ substituted for K+ (154.3 mm) in the bathing solution (solution C). Ramp command voltages were applied from −125 to +35 mV at a rate of 200 mV s−1. Inset, expanded scale trace for the same experiments.
Figure 2
Figure 2. Effects of Ba2+ on the Kir currents
A, representative tracings of whole-cell currents obtained from a single BPA cells in the absence and the presence of Ba2+ (10−5 and 10−4m) in the bathing solution containing 150 mm KCl (solution C). Currents were elicited by voltage steps ranging from −105 to −5 mV in 10 mV increments, each of 3 s duration. Voltage pulses were separated by a 7 s interval and holding potential was −5 mV. B, upper panel, steady-state I-V relationships of whole-cell currents recorded from BPA cells in the presence of 150 mm KCl with varying concentrations of extracellular Ba2+. Steady-state whole-cell currents were measured at 3 s from the start of each voltage pulse. Each point represents the mean ± s.e.m. of 5 experiments. Lower panel, fractional current at steady-state plotted against Ba2+ concentration at a holding potential of −105, −75, −45 or −15 mV. Each point represents the mean ± s.e.m. of 5 experiments. The lines are fits to the Hill equation (eqn (2)). C, Ba2+ concentration dependence of the steady-state block of whole-cell currents at different holding potentials. Each point represents the mean ± s.e.m. of 5 experiments. The line is the fit to eqn (3). D, plot of the blocking time constant as a function of membrane potential. The data points were obtained in the presence of 10−5m Ba2+ and represent means ± s.e.m. of 5 experiments. Inset, representative traces of the currents obtained from a single BPA cell. The currents were elicited by voltage steps to −105, −75 and −45 mV from a holding potential of −5 mV in the presence of 10−5m Ba2+ in the bathing solution. The lines are the fit to a single exponential using a least-squares method.
Figure 3
Figure 3. Effects of Cs+ on the Kir currents
A, representative tracings of whole-cell currents obtained from a single BPA cell in the absence and the presence of Cs+ (10−4, 10−3 and 10−2m) in the bathing solution containing 140 mm KCl (solution D). Currents were elicited by voltage steps from a holding potential of −7 to −117 mV (left panel) or by voltage ramps from −127 to −7 mV at rate of 200 mV s−1 (right panel). B, upper panel, I-V relationships of whole-cell currents recorded from BPA cells in the presence of 140 mm KCl with varying concentrations of extracellular Cs+. Whole-cell currents were elicited by the voltage ramp protocol. Each point represents the mean ± s.e.m. of 5 experiments. Lower panel, fractional current at steady-state plotted against Cs+ concentration at a holding potential of −117, −87 or −57 mV. Each point represents the mean ± s.e.m. of 5 experiments. The lines are fits to the Hill equation (eqn (2)). C, Cs+ concentration dependence of the steady-state block of whole-cell currents at different holding potentials. Each point represents the mean ± s.e.m. of 6 experiments. The line is the fit to eqn (3).
Figure 4
Figure 4. Single channel records from cell-attached patches in BPA cells
A, representative single channel tracings and corresponding I-V relations of the 27 pS (left and right panels, •) and the 16 pS (middle and right panels, ○) channels in three different cell-attached patches at different voltages (-Vp). In the right panel, a representative single channel tracing and corresponding I-V relations obtained from a patch containing both the 27 pS and the 16 pS channels are also shown. The arrows indicate before and after opening of the 16 pS channels. Voltage (-Vp) is displacement of intracellular potential. Zero millivolts indicates that patch membrane was held at resting membrane potential and +3 mV indicates that it was held at a potential 3 mV more positive than resting membrane potential. Data were obtained from the patch shown. The pipette solution was KCl-rich (solution E). B, single channel I-V relation of the 27 pS channel in cell-attached patches for pipette K+ concentrations of 150 mm (•, n = 14), 100 mm (○, n = 5), 30 mm (▪, n = 5), 10 mm (□, n = 5) and 5 mm (▴, n = 5). A solution containing 5 mm K+ (solution B) was used as a bath solution. The resting potential was most influenced by the equilibrium potential for potassium (EK) and was around −60 mV. C, plot of the conductances of the 27 pS channel in cell-attached patches as a function of pipette K+ concentration. The solid line is a nonlinear least-squares fit of the Michaelis-Menten eqn (1) (see Methods); data are from B. D, log-log plot of the single channel conductance of the 27 pS channel in cell-attached patches as a function of pipette K+ concentration. The solid line is the line of best fit; data are from B. E, semi-logarithmic plot of the apparent reversal potential of the 27 pS K+ channel as a function of pipette K+ concentration in cell-attached patches. The apparent reversal potential of the inward current was estimated by a linear least-squares method and by extrapolation from the data shown in B. The solid line is the line of best fit; data are from B.
Figure 5
Figure 5. Effects of Ba2+ on resting membrane potential of BPA cells
A, representative tracings of single maxi-K+ channel current in a cell-attached patch in the absence or the presence of Ba2+ (100 µm or 1 mm) in the bath solution. Voltage (-Vp) was +83 mV. The patch pipette was filled with the KCl-rich (150 mm K+) solution (solution E) and the bath contained the standard NaCl-rich solution (solution B). B, I-V relations of maxi-K+ channel obtained from the patch shown in A before (○), during (100 µm (•) or 1 mm (▪) addition of Ba2+ to the bathing solution and after washout of Ba2+ (□). C, Ba2+ (100 µm or 1 mm)-induced changes in Vm indicated by the reversal of single maxi-K+ channel current in cell-attached patches. Application of TEA (10 mm) to the bathing solution did not shift the reversal potential.
Figure 6
Figure 6. RT-PCR analysis of bKir2.1 channel
A ethidium bromide-stained agarose gel showing RT-PCR products generated from total RNA isolated from freshly dissociated bovine parotid acinar cells using Kir2.1-specific primers. Size markers (1 kb DNA ladder, Life Technologies, Inc.) of representative bands are also indicated. Arrows show the RT-PCR products for bKir2.1 at 4699 and 636 bp and for β-actin at 510 bp.
Figure 7
Figure 7. Immunofluorescence labelling for Kir2.1 in bovine parotid gland
A, control: no labelling is observed. Bar indicates 20 µm. B, acini: peripheries of acinar cells (arrows) are labelled. C, interstitial segment: labelling is observed clearly in entire periphery of interstitial segment cells. D, striated duct: striated duct (arrow) where no labelling is observed.

Similar articles

Cited by

References

    1. Abrams CJ, Davies NW, Shelton PA, Stanfield PR. The role of a single aspartate residue in ionic selectivity and block of a murine inward rectifier K+ channel Kir2. 1. J Physiol. 1996;493:643–649. - PMC - PubMed
    1. Alagem N, Dvir M, Reuveny E. Mechanism of Ba2+ block of a mouse inwardly rectifying K+ channel: differential contribution by two discrete residues. J Physiol. 2001;534:381–393. - PMC - PubMed
    1. Barry PH, Lynch JW. Liquid junction potentials and small cell effects in patch-clamp analysis. J Membr Biol. 1991;121:101–117. - PubMed
    1. Bradley KK, Jaggar JH, Bonev AD, Heppner TJ, Flynn ER, Nelson MT, Horowitz B. Kir2. 1 encodes the inward rectifier potassium channel in rat arterial smooth muscle cells. J Physiol. 1999;515:639–651. - PMC - PubMed
    1. Church DC. Salivary function and production. In: Church DC, editor. The Ruminant Animal. Digestive Physiology and Nutrition. Englewood Cliffs, NJ, USA: Prentice Hall; 1988. pp. 117–124.

Publication types

LinkOut - more resources