. 2003 Mar 15;547(Pt 3):807-23.
doi: 10.1113/jphysiol.2002.035204. Epub 2003 Jan 31.

Effects of oxidation and cytosolic redox conditions on excitation-contraction coupling in rat skeletal muscle

Affiliations

Effects of oxidation and cytosolic redox conditions on excitation-contraction coupling in rat skeletal muscle

G S Posterino et al. J Physiol. .

Abstract

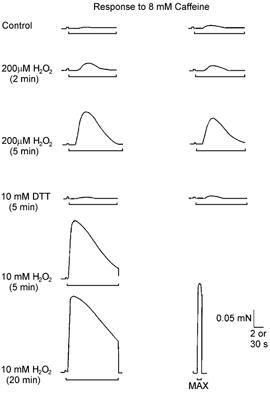
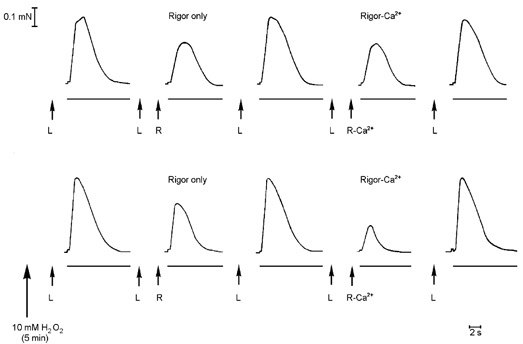
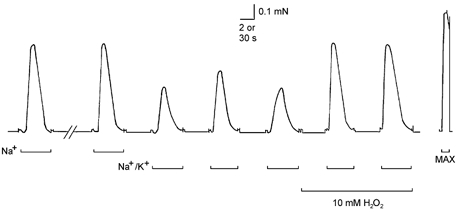
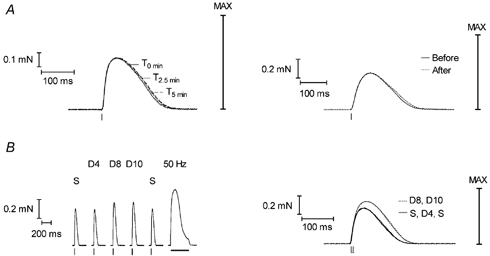
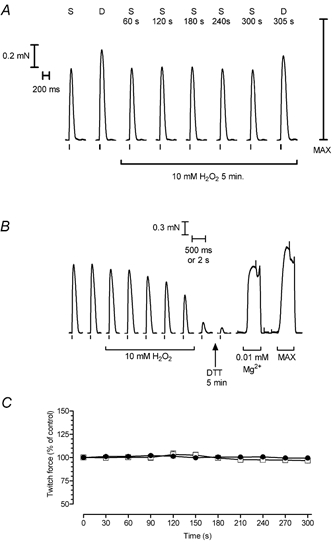
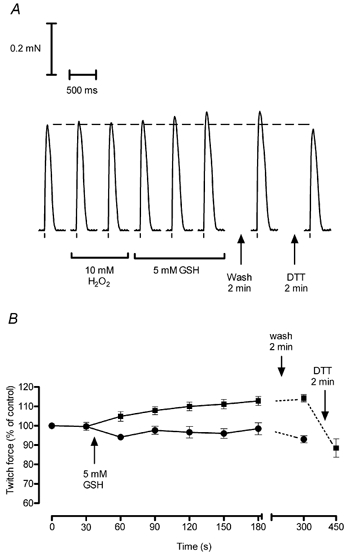
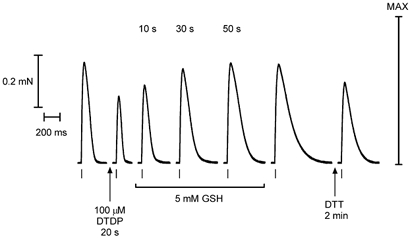
In this study the effects of oxidation and reduction on various steps in the excitation-contraction (E-C) coupling sequence was examined in mammalian skeletal muscle. In mechanically skinned fast-twitch fibres, electric field stimulation was used to generate action potentials in the sealed transverse-tubular (T-) system, thereby eliciting twitch responses, which are a sensitive measure of Ca2+ release. Treatment of fibres with the oxidant H2O2 (200 microM and 10 mM) for 2-5 min markedly potentiated caffeine-induced Ca2+ release and the force response to partial depolarisation of the T-system (by solution substitution). Importantly, such H2O2 treatment had no effect at all on any aspect of the twitch response (peak amplitude, rate of rise, decay rate constant and half-width), except in cases where it interfered with the T-system potential or voltage-sensor activation, resulting in a reduction or abolition of the twitch response. Exposure to strong thiol reductants, dithiothreitol (DTT, 10 mM) and reduced glutathione (GSH, 5 mM), did not affect the twitch response over 5 min, nor did varying the glutathione ratio (reduced to oxidised glutathione) from the level present endogenously in the cytosol of a rested fibre (30:1) to the comparatively oxidised level of 3:1. In fibres that had been oxidised by H2O2 (10 mM) (or by 2,2'-dithiodipyridine, 100 microM), exposure to GSH (5 mM) caused potentiation of twitch force (by approximately 20 % for H2O2); this effect was due to the increase in the Ca2+ sensitivity of the contractile apparatus that occurs under such circumstances and was fully reversed by subsequent exposure to 10 mM DTT. We conclude that: (a) the redox potential across the sarcomplamsic reticulum has no noticeable direct effect on normal E-C coupling in mammalian skeletal muscle, (b) oxidising the Ca2+-release channels and greatly increasing their sensitivity to Ca2+-induced Ca2+ release does not alter the amount of Ca2+ released by an action potential and (c) oxidation potentiates twitches by a GSH-mediated increase in the Ca2+ sensitivity of the contractile apparatus.


Figures

Figure 1
Figure 1. H2O2 treatment potentiates caffeine-induced Ca2+ release
Force response to 8 mm caffeine (indicated by bar, 2 s time calibration) in a mechanically skinned extensor digitorum longus (EDL) fibre. The fibre was subjected to repeated cycles in which the SR was emptied of Ca2+, reloaded for a set time and then 8 mm caffeine applied (see Methods). Between cycles, the fibre was given various treatments (shown on left). The responses to 8 mm caffeine were obtained in order from left to right and top to bottom. The first pair of force responses was elicited in a freshly skinned fibre (Control). Both responses were relatively small (∼2–3 % of the maximum Ca2+-activated force, MAX, bottom right panel) and exhibited a considerable delay (∼2 s) before force developed. Treatment with 200 μm H2O2 for 2 min increased the response to 8 mm caffeine approximately twofold and an additional 3 min treatment caused a further increase (∼10-fold in total). The effect of H2O2 was fully reversed by treatment with 10 mm DTT. Treatment with 10 mm H2O2 for 5 and 20 min produced more marked effects on the 8 mm caffeine response; the peak size increased to ∼65 % and ∼85 % of MAX, respectively. Time calibration for MAX: 30 s.
Figure 2
Figure 2. H2O2 treatment potentiates Ca2+-induced Ca2+ release (CICR)
Force responses in a fibre when repeatedly emptying the SR of all Ca2+ (full release solution, see Methods). In the top traces, before H2O2 treatment, the SR was loaded (L) for a set period of 30 s and either emptied straightaway or exposed to a set of rigor solutions (R, no ATP) for 2 min and then emptied. The relative decrease in the response in the latter case (‘Rigor only’) indicates the amount of Ca2+ lost from the SR during the period in the rigor solutions. Exposure to 2 μm free Ca2+ for 30 s during the rigor period did not increase the amount of Ca2+ lost from the SR (compare traces labelled ‘Rigor only’ and ‘Rigor-Ca2+’), showing there was no detectable CICR under those conditions. After H2O2 treatment (lower traces) there was considerable CICR, as shown by the relatively small response for the ‘Rigor-Ca2+’ case. The ‘Rigor only’ protocol was repeated after the ‘Rigor-Ca2+’ protocol in each case (not shown). The loading period (L) had to be increased to 40 s after H2O2 treatment to reach the same SR Ca2+ content (see text).
Figure 5
Figure 5. H2O2 treatment potentiates the force response to submaximal depolarisation elicited by solution substitution
A skinned EDL fibre (pretreated with TTX) was depolarised by substituting the standard high [K+] solution with a matching Na+ solution with no K+ (see Methods), eliciting Ca2+ release and a large force response lasting 2–3 s. When the T-system was depolarised only partially by substituting a Na+/K+ solution containing 12 mm K+, the resulting force response was approximately twofold smaller than the response to full Na+ substitution. Application of 10 mm H2O2 greatly increased both the peak and rate of rise of the force response to submaximal depolarisation. Time scale: 2 s during depolarisations (bars) and 30 s between depolarisations and maximum Ca2+-activated force (MAX).
Figure 3
Figure 3. Twitch responses in skinned fibres in control and reducing conditions
A, twitch responses in a mechanically skinned EDL fibre with no redox agents present (left panel). Responses at three different times (T) are shown superimposed. The response was virtually unchanged over 5 min, except for a small increase in the half-width. The maximum Ca2+-activated force (MAX) is indicated. The right panel shows twitch responses in another fibre before and immediately after a 5 min treatment with 10 mm DTT; the twitch response was little changed, showing only a slight increase in half-width, as occurs with time alone (left panel). B, responses in a fibre stimulated with either a single electric field pulse (S) or a pair of pulses 4–10 ms apart (double pulse, D). Responses are shown in sequence in the left panel and superimposed in the right panel. Stimulating with two pulses 4 ms apart (D4) gave a virtually identical response to stimulating with a single pulse. Increasing the interval between the two pulses to 8 ms elicited a substantially larger response, with no further change occurring when increasing the interval between the pulses to 10 ms (D10). The tetanic response to 50 Hz stimulation (horizontal bar) reached maximum Ca2+-activated force (MAX). Small vertical ticks beneath twitch responses show the time of applied stimuli.
Figure 4
Figure 4. Effect of H2O2 treatment on twitch force responses
A, responses in a skinned fibre to stimulation with either a single action potential (S) or two action potentials 10 ms apart (D). The twitch response to a single action potential remained virtually unchanged over a 5 min exposure to 10 mm H2O2 and the response elicited by a pair of action potentials afterwards was only slightly smaller than its initial control level. B, example of exposure to 10 mm H2O2 causing abolition of twitch responses in an EDL fibre; lowering [Mg2+] from 1 to 0.01 mm still induced sarcoplasmic reticulum (SR) Ca2+ release and contraction. C, mean (±s.e.m.) of the peak amplitude of the twitch response during 5 min exposure to 10 mm H2O2 in EDL fibres where excitation–contraction coupling was not interrupted (circles; eight fibres) and in fibres maintained in control conditions for a similar period (squares; five fibres). The error bars are smaller than the symbols. Twitch responses in each fibre were normalised to the response obtained under control conditions immediately before the respective 5 min test period. There was no significant difference between the groups in the size of control response as a percentage of maximum Ca2+-activated force (67 ± 7 %, n = 5; 58 ± 6 %, n = 8; P > 0.05).
Figure 6
Figure 6. Exposure of H2O2-oxidised fibres to reduced glutathione (GSH) causes potentiation of twitch force
A, the twitch response in a skinned EDL fibre was virtually unchanged during a 2 min exposure to 10 mm H2O2 (responses elicited every 30 s, last two shown), but increased progressively during a subsequent 2.5 min exposure to GSH (5 mm). The response was unchanged when the GSH was washed out, but decreased to close to the original control level (dashed line) following a 2 min treatment with 10 mm DTT. B, mean data (±s.e.m.) of relative twitch size in six fibres exposed successively to H2O2 and GSH as in A (squares) and six other fibres exposed to GSH without a preceding exposure to H2O2 (circles). The response following DTT exposure was obtained in only four of the six fibres exposed to H2O2 and GSH. Twitch forces in each fibre were normalised to the first of the two ‘control’ responses obtained preceding GSH exposure.
Figure 7
Figure 7. GSH potentiates twitch force in dithiodipyridine (DTDP)-oxidised fibres
The twitch response in an EDL fibre decreased in both peak amplitude and half-width after a brief (20 s) exposure to 100 μm DTDP (in the absence of any stimulation). When the fibre was subsequently exposed to 5 mm GSH and stimulated at ∼20 s intervals (time in GSH shown), the twitch response increased progressively in peak amplitude and half-width, with each reaching a steady level within 1–2 min. These changes persisted when GSH was washed out. Subsequent exposure to 10 mm DTT for 2 min partially reversed the potentiation occurring with GSH treatment.

Similar articles

Cited by

References

    1. Allen DG, Lännergren J, Westerblad H. Muscle cell function during prolonged activity: cellular mechanisms of fatigue. Exp Physiol. 1995;80:497–527. - PubMed
    1. Allen DG, Lännergren J, Westerblad H. Intracellular ATP measured with luciferin/luciferase in isolated single mouse skeletal muscle fibres. Pflügers Arch. 2002;443:836–842. - PubMed
    1. Andrade FH, Reid MB, Allen DG, Westerblad H. Effect of hydrogen peroxide and dithiothreitol on contractile function of single skeletal muscle fibres from the mouse. J Physiol. 1998;509:565–575. - PMC - PubMed
    1. Bakker AJ, Lamb GD, Stephenson DG. The effect of 2,5-di-(tert-butyl)-1, 4-hydroquinone on force responses and the contractile apparatus in mechanically skinned muscle fibres of the rat and toad. J Muscle Res Cell Motil. 1996;17:55–67. - PubMed
    1. Balog EM, Fitts RH. Effects of depolarisation and low intercellular pH on charge movement currents of frog skeletal muscle fibers. J Appl Physiol. 2001;90:228–234. - PubMed

Publication types

MeSH terms

LinkOut - more resources