. 2003 Mar 1;547(Pt 2):509-30.
doi: 10.1113/jphysiol.2002.030304. Epub 2003 Jan 24.

Rod and cone contributions to the a-wave of the electroretinogram of the macaque

Affiliations

Rod and cone contributions to the a-wave of the electroretinogram of the macaque

John G Robson et al. J Physiol. .

Abstract

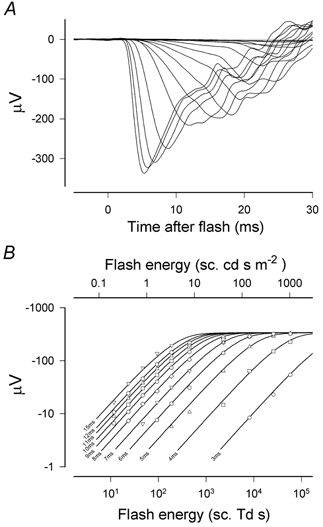
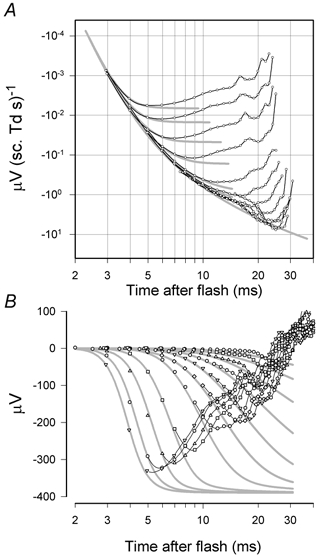
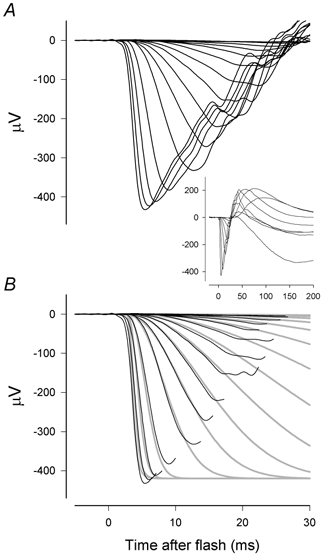
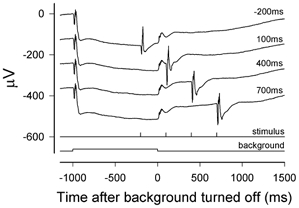
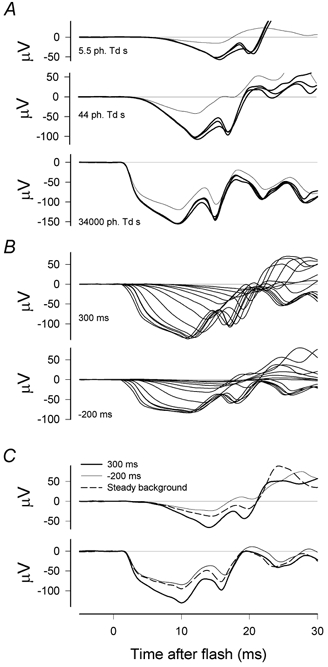
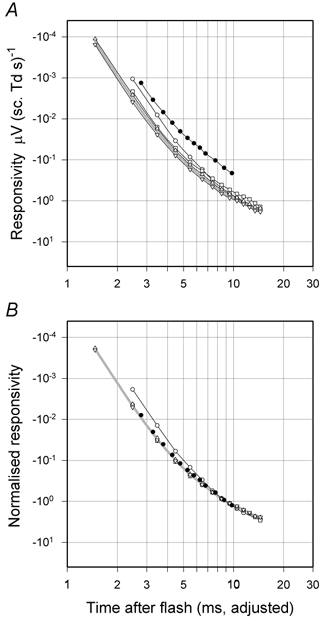
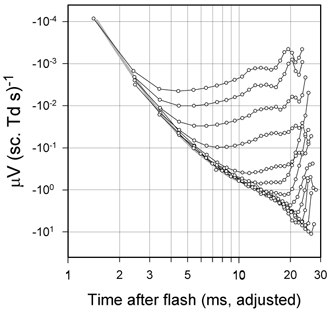
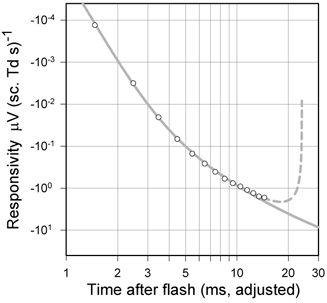
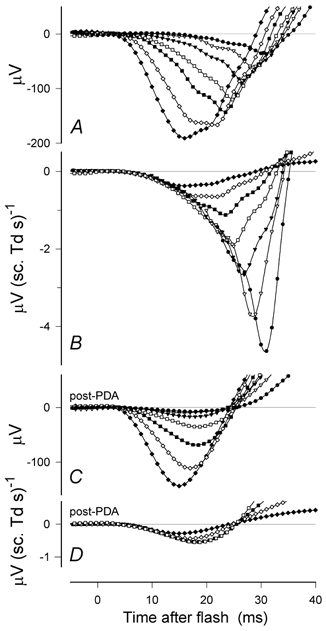
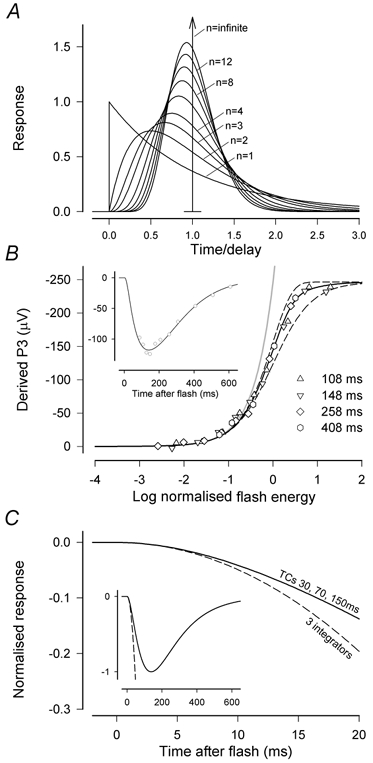
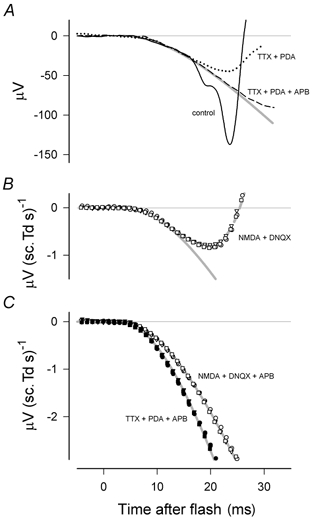
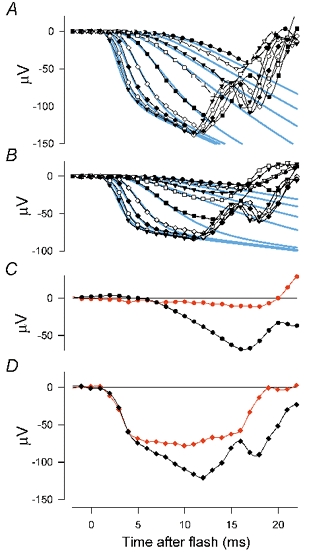
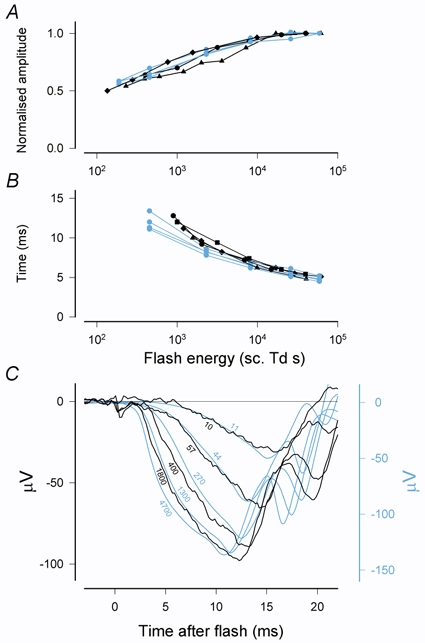
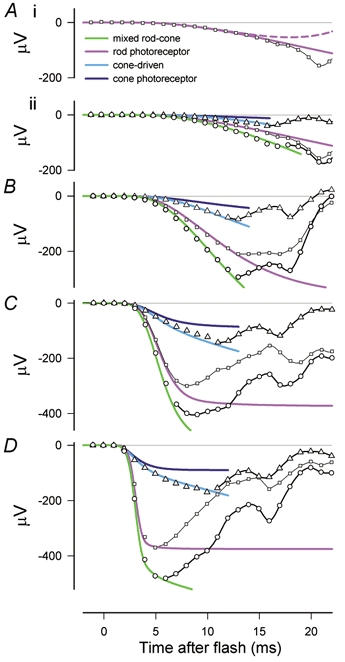
The electroretinogram (ERG) of anaesthetised dark-adapted macaque monkeys was recorded in response to ganzfeld stimulation and rod- and cone-driven receptoral and postreceptoral components were separated and modelled. The test stimuli were brief (< 4.1 ms) flashes. The cone-driven component was isolated by delivering the stimulus shortly after a rod-saturating background had been extinguished. The rod-driven component was derived by subtracting the cone-driven component from the mixed rod-cone ERG. The initial part of the leading edge of the rod-driven a-wave scaled linearly with stimulus energy when energy was sufficiently low and, for times less than about 12 ms after the stimulus, it was well described by a linear model incorporating a distributed delay and three cascaded low-pass filter elements. Addition of a simple static saturating non-linearity with a characteristic intermediate between a hyperbolic and an exponential function was sufficient to extend application of the model to most of the leading edge of the saturated responses to high energy stimuli. It was not necessary to assume involvement of any other non-linearity or that any significant low-pass filter followed the non-linear stage of the model. A negative inner-retinal component contributed to the later part of the rod-driven a-wave. After suppressing this component by blocking ionotropic glutamate receptors, the entire a-wave up to the time of the first zero-crossing scaled with stimulus energy and was well described by summing the response of the rod model with that of a model describing the leading edge of the rod-bipolar cell response. The negative inner-retinal component essentially cancelled the early part of the rod-bipolar cell component and, for stimuli of moderate energy, made it appear that the photoreceptor current was the only significant component of the leading edge of the a-wave. The leading edge of the cone-driven a-wave included a slow phase that continued up to the peak, and was reduced in amplitude either by a rod-suppressing background or by the glutamate analogue, cis-piperidine-2,3-dicarboxylic acid (PDA). Thus the slow phase represents a postreceptoral component present in addition to a fast component of the a-wave generated by the cones themselves. At high stimulus energies, it appeared less than 5 ms after the stimulus. The leading edge of the cone-driven a-wave was adequately modelled as the sum of the output of a cone photoreceptor model similar to that for rods and a postreceptoral signal obtained by a single integration of the cone output. In addition, the output of the static non-linear stage in the cone model was subject to a low-pass filter with a time constant of no more than 1 ms. In conclusion, postreceptoral components must be taken into account when interpreting the leading edge of the rod- and cone-driven a-waves of the dark-adapted ERG.


Figures

Figure 4
Figure 4. Isolated rod-driven ERG
A, records showing the first 30 ms of isolated rod responses obtained with a wide range of stimulus energies (see Fig. 1 for the mixed rod–cone responses from the same session, sm451). B, amplitude of the responses measured at fixed times between 3 and 15 ms after the flash vs. stimulus energy on double-logarithmic scales. Data have been fitted with eqn (1) as an ensemble (i.e. with a common value for Vmax) using a Levenberg-Marquardt error minimisation method. Response is initially proportional to stimulus energy but then saturates in a manner intermediate between an exponential and a hyperbolic function (eqn (1), F= 0.7).
Figure 11
Figure 11. Fits of non-linear model to rod-driven responses
A, energy-scaled rod-driven responses from macaque XE (Fig. 4) plotted on double-logarithmic axes and fitted with lines generated by a model that included non-linear saturation. The delay and sensitivity parameters were chosen to provide a good fit of the linear kernel of the model to the envelope of the data at early times (< 12 ms) and then Vmax was adjusted to give a good fit to the later part of the leading edge of the a-wave. B, same results plotted without energy scaling on semi-logarithmic axes to show the fit of the model at early times. The grey lines show fits of the non-linear rod photoreceptor model described in the text. Parameter values were obtained by fitting data points earlier than 11 ms, and having amplitudes less than 80 % of the peak, as an ensemble using the downhill simplex method of Nelder and Mead to minimise the total unweighted squared error over the data set. Points used for parameter estimation have been left unconnected by black lines. The time scales have not been adjusted to take account of the delay introduced by the low-pass filter of the recording system.
Figure 1
Figure 1. Dark-adapted mixed rod-cone ERG
A, energy of blue flashes in A and B increased from 0.37 to 188 sc. Td s (0.086–43.8 ph. Td s) by factors of 2 in nine steps; the strongest five flashes were white with energies of 450, 2300, 8200, 26000 and 59000 sc. Td s (270, 1300, 4700, 14800, 33500 ph. Td s). The inset shows selected responses on a longer time scale so that the whole ERG can be viewed. B, the early part of records fitted with a simple delayed Gaussian model of the leading edge of rod photoresponses (Lamb & Pugh, 1992; Breton et al. 1994). (Subject: XE; session: sm451.)
Figure 2
Figure 2. Isolating the cone-driven response
Responses to a blue test flash of 44 ph. Td s (188 sc. Td s) presented at different times relative to a rod-saturating background of 2500 sc. Td that was on for 1 s in every 3 s. The top trace shows the response to a test flash delivered 800 ms after turning the background on (i.e. −200 ms relative to turning it off). The next traces show, successively, responses to flashes delivered 100, 400 and 700 ms after turning the background off. (XE, sm465.) The dark-adapted response to the same stimulus can be seen in Fig. 1 for the same animal recorded in another session.
Figure 3
Figure 3. Isolated cone-driven responses
A, responses to a blue test flash of 5.5 ph. Td s (top records), a blue test flash of 44 ph. Td s (middle records) and a white flash of 34 000 ph. Td s (bottom records) delivered 800 ms after turning on a rod-saturating background (thin line) or 100, 400 or 700 ms after turning it off. Dark-adapted responses to the same stimuli can be seen in Fig. 1. (XE, sm465.) B, families of responses to flashes of different energies delivered either 300 ms after turning off the background that was on for 1 s in every 3 s (top records) or 800 ms after turning it on (i.e. −200 ms relative to turning off the background; bottom records). Flash energies were 5.5, 11, 22, 44, 270, 1300, 4700, 4700, 15 000, 34 000 ph. Td s (24–59 000 sc. Td s) (ZE, sm468.) C, responses to a blue test flash of 5.5 ph. Td s (top records) and a white flash of 34000 ph. Td s (bottom records) delivered 300 ms after turning the background off (thick line), 800 ms after turning the background on (i.e. −200 ms relative to turning off the background; thin line) or presented on a continuous background (dashed line). (ZE, sm468.)
Figure 5
Figure 5. Rod responsivity at early times
A, shown on double-logarithmic axes (open circles) are the estimates of rod responsivity obtained from the fits of the curves in Fig. 4B as a function of time (3–15 ms). Similar measurements (open symbols) made on two other macaques one of which (DE, triangles) was tested on two separate occasions (sm466 and sm469). The filled circles are for a single human ERG (TDL, data from Friedburg et al. 2001). B, plots from A arbitrarily normalised to unity at 9 ms after the flash. In both A and B the time has been adjusted to take account of the group delay of the recording filter (0.53 ms for the macaques and 0.23 ms for human). The grey line is drawn through the means of the two sets of readings from macaque DE.
Figure 6
Figure 6. Energy-scaled rod a-wave
Rod a-wave records for macaque DE (similar to those of Fig. 4A) have been scaled by stimulus energy and replotted on the same double-logarithmic axes as Fig. 5A. The figure also contains a replot of the curve from Fig. 5 with interpolated responsivity values for the same macaque. As in Fig. 5 the time scale has been adjusted to take account of delay introduced by the low-pass filter of the recording system. Responses generated by LED pulses were subject to small corrections at early times to take account of the stimulus duration. This was done by assuming that the effect of stimulus duration would be the same on the recordings as it was calculated to be for the model that was subsequently fitted to the data.
Figure 9
Figure 9. Linear model of rod photoresponse
A linear model as described in the text was fitted to isolated rod a-wave responsivity vs. time for one animal (DE), two sessions averaged, and plotted on double-logarithmic axes (sm466 and sm469). The continuous grey line shows the linear responses of a model with the following parameters: delay 3.35 ms of order n= 13, phototransduction time constants 30, 70 and 150 ms. The delay, the value of n and a sensitivity parameter were adjusted to provide a good fit by eye to the first 12 ms of the data. The dashed grey line is the prediction of a model that includes a positive PII component that is generated as the third integral of the response predicted by the rod model. The relative responsivity of the PII component is set to a value that results in the rod and PII responses summing to zero at 24 ms after the flash, a typical time for the zero crossing obtained after blocking all postreceptoral responses other than those of ON bipolar cells (see Fig. 10B for an example). The time scale has been adjusted to take account of the group delay of 0.53 ms introduced by the low-pass filter of the recording system.
Figure 7
Figure 7. ERG responses to seven stimuli of energies increasing by factors of two from 7.9 to 509 sc. Td s
A, rod-driven ERG obtained after subtracting cone-driven responses from mixed rod-cone ERG (not shown). B, replot of the records in A scaled by stimulus energy. C, responses to the same range of stimulus energies after intravitreal injection of PDA (4 mm). D, replot of the records in C scaled by stimulus energy. (NI, sm404.)
Figure 8
Figure 8. Rod photoreceptor model functions
A, impulse response of the delay function described by eqn (2). When n becomes very large the function approaches an impulse at time 1, equivalent to an ideal transport delay. The form of this function for values of n between 1 and 14 is shown in diagram. B, the derived rod response to test flashes covering a range of energies at 108, 148, 258 and 408 ms estimated using a saturating probe-flash procedure. The probe flash had an energy of 15 000 sc. Td s and responses were measured 8 ms after it was delivered. The data were first fitted as an ensemble with a saturating function intermediate between an exponential and a hyperbolic function (eqn (1) with F= 0.7) to provide a single value for the maximum response and a responsivity constant for each time. The responsivity constants were then used to normalise the data for each time to obtain the superimposed values that are plotted. The continuous line shows the model fit for F= 0.7 while the dashed lines show the exponential and hyperbolic functions (F= 1 and F= 0, respectively). The inset shows measurements of the derived rod response at various times after a test flash of 2.5 sc. Td s. The line is the response of a model having a delay of 3.0 ms, a three-stage filter with time constants of 30, 70 and 150 ms and a saturating non-linearity intermediate between an exponential and a hyperbolic function (eqn (1) with F= 0.7). (XE, sm410.) C, comparison of the time course of the normalised linear impulse response using two different formulations, one that includes three integrations (Lamb & Pugh, 1992), and one that contains the three time constants (TCs) estimated from saturating probe-flash measurements of the later time course of the rod photocurrent as in B. Inset shows the same comparison on reduced scales to show the entire time course of the impulse response.
Figure 10
Figure 10. Effect of pharmacological suppression of postreceptoral responses
A, superimposed unscaled responses to a flash of 19.8 sc. Td s both before administering any drug (continuous black line) as well as after injecting TTX and PDA (dotted line) and then APB (dashed line) (SN, sm241). The continuous grey line was generated by fitting the linear rod model described in the text. B, energy-scaled responses following intravitreal injection of NMDA and DNQX to block all postreceptoral activity other than that of ON bipolar cells (ES, sm188). The dashed grey line is the sum of the linear responses of models of rod photoreceptors and ON bipolar cells (see text and Fig. 9). The continuous grey line shows the modelled photoreceptor response alone. Flash energies were 16, 32 and 64 sc. Td s. C, energy-scaled responses of two animals following intravitreal injections of NMDA, DNQX and APB (ES, sm188, open symbols) or TTX, PDA and APB (SN, sm241, filled symbols). Grey lines are linear responses of the rod photoreceptor model described in the text; parameters were chosen to give the best fit by eye. Flash energies for sm241 were 4.5, 8.9 and 19.8 sc. Td s.
Figure 12
Figure 12. Cone-driven receptoral and postreceptoral responses
A, responses to stimuli of different strengths (blue: 6.9, 13.7, 27.4, 55 and white: 270, 1300, 4740, 14800, 33600 ph. Td s) all applied 300 ms after a rod-saturating adapting light was turned off. B, responses to the same set of stimuli delivered 800 ms after the adapting light was turned on. The blue lines show fits of the model described in the text that combines the response of cone photoreceptors with a postreceptoral response generated as the integral of the cone response. (XE, sm451.) C and D, pairs of responses to stimuli with energies near the extremes of the families shown in A and B before (black symbols and lines) and after (red) administration of PDA. (XE, sm409.)
Figure 13
Figure 13. Comparison of macaque (blue) and human (black) ERG a-waves
A, comparison of peak amplitudes of rod-driven a-waves of three macaques (XE, ZE and DE) with published measurements on several normal humans (Cideciyan & Jacobson, 1993; Thomas & Lamb, 1999; Friedburg et al. 2001). a-wave peak amplitudes have been normalised to their maximum value. B, times-to-peak of rod-driven a-waves adjusted by very small amounts to take account of the different stimulus durations and recording filters used in the different studies. Data of Breton et al. (1994) from mixed rod-cone ERGs are also included here. C, cone-driven responses from a macaque (blue) together with a set from a human (NS, data from Paupoo et al. (2000); black). Numbers on the curves are stimulus energies in ph. Td s. Apart from a very small time shift to allow for different recording filters and an arbitrary adjustment of the relative amplitude scales to bring the two sets of records into line, no other adjustments have been made.
Figure 14
Figure 14. Macaque a-waves for stimuli of four different energies
Stimulus energies increase from A to D. The data points show the recorded mixed rod–cone ERG (circles), the smaller cone-driven ERG obtained after suppressing the rods (triangles), and the isolated rod-driven ERG (squares). The purple and dark blue lines plot, respectively, the responses of models described in the text for the rod and cone photoreceptor responses; the light blue and the green lines show the model responses for the cone-driven ERG (cone photoreceptor response combined with a cone-driven postreceptoral component) and the mixed rod-cone ERG (modelled rod photoreceptor response combined with the modelled cone-driven ERG). At later times when the data points are not described by the models, they are joined by black lines (DE, sm469). A, blue flash: 23.5 sc. Td s, 7.1 ph. Td s. Ai and Aii show the responses to a blue flash that is in the linear range for the rods and rod-bipolar cells. Ai includes the response of the linear photoreceptor–rod-bipolar cell model (dashed purple line). The recorded response deviates from this combined model after about 12–13 ms due to intrusion of a negative postreceptoral component, but remarkably continues to follow the modelled rod photoreceptor response for several milliseconds. B, blue flash: 188 sc. Td s, 57 ph. Td s. C, white flash: 2300 sc. Td s, 1300 ph. Td s. D, white flash: 59 000 sc. Td s, 34 000 ph. Td s.

Similar articles

Cited by

References

    1. Baylor DA, Hodgkin AL, Lamb TD. The electrical responses of turtle cones to flashes and steps of light. J Physiol. 1974;242:685–727. - PMC - PubMed
    1. Baylor DA, Nunn BJ, Schnapf JL. The photocurrent, noise and spectral sensitivity of rods of the monkey Macaca fascicularis. J Physiol. 1984;357:575–607. - PMC - PubMed
    1. Breton ME, Schueller AW, Lamb TD, Pugh EN., Jr Analysis of ERG a-wave amplification and kinetics in terms of the G-protein cascade of phototransduction. Invest Ophthalmol Vis Sci. 1994;35:295–309. - PubMed
    1. Bush RA, Sieving PA. A proximal retinal component in the primate photopic ERG a-wave. Invest Ophthalmol Vis Sci. 1994;35:635–645. - PubMed
    1. Cideciyan AV, Jacobson SG. Negative electroretinograms in retinitis pigmentosa. Invest Ophthalmol Vis Sci. 1993;34:3253–3263. - PubMed

Publication types

LinkOut - more resources