. 2003 Mar 1;547(Pt 2):357-71.
doi: 10.1113/jphysiol.2002.029785. Epub 2003 Jan 17.

Variation in large-conductance, calcium-activated potassium channels from hair cells along the chicken basilar papilla

Affiliations

Variation in large-conductance, calcium-activated potassium channels from hair cells along the chicken basilar papilla

R K Duncan et al. J Physiol. .

Abstract

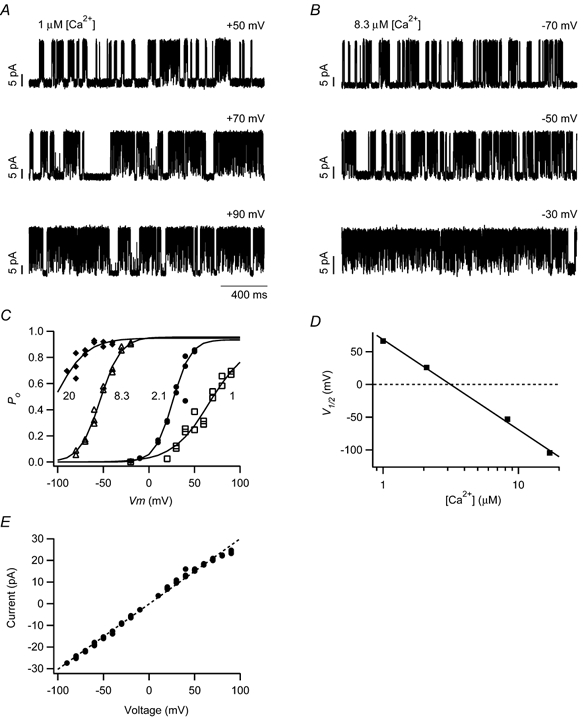
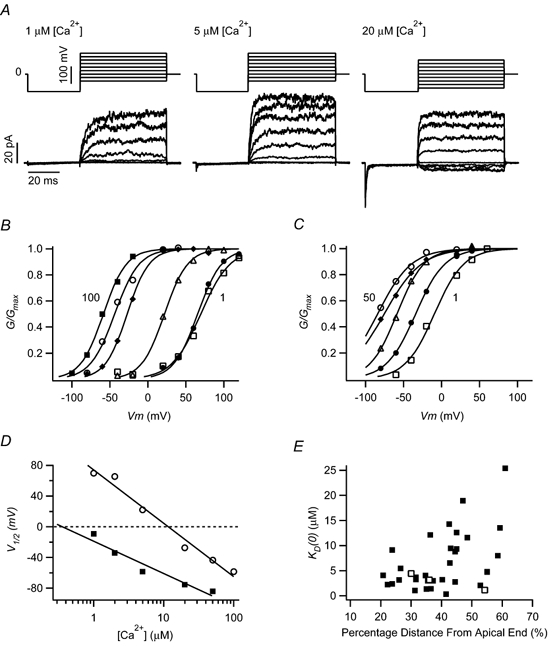
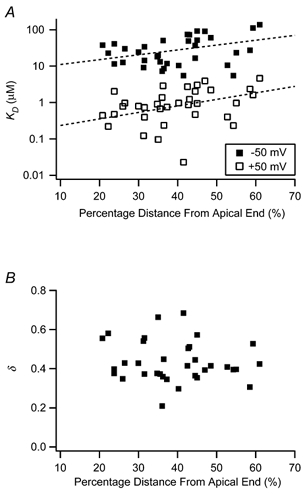
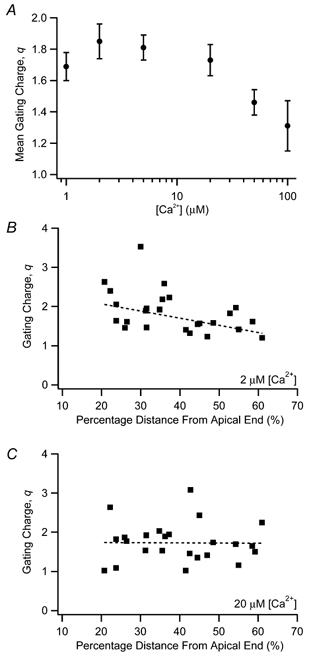
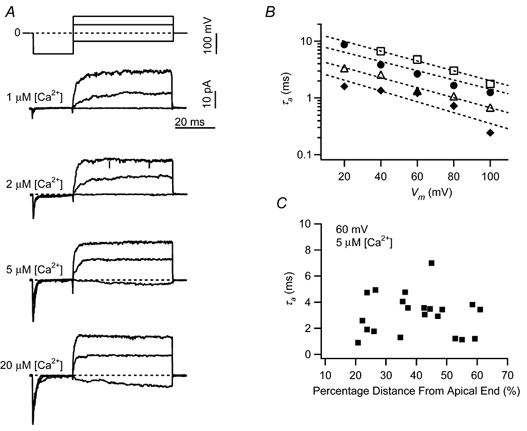
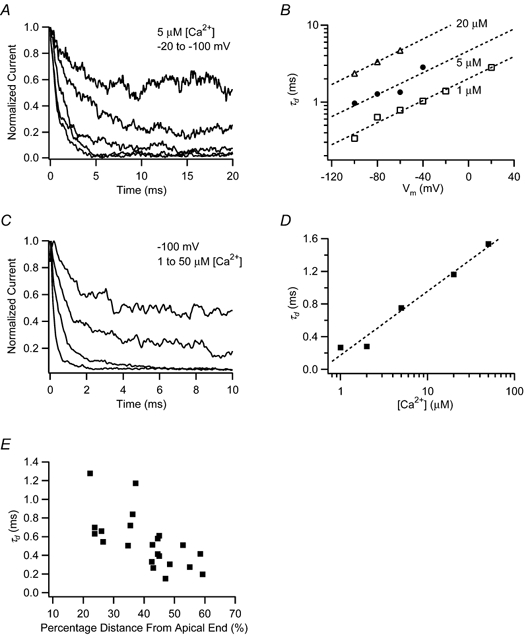
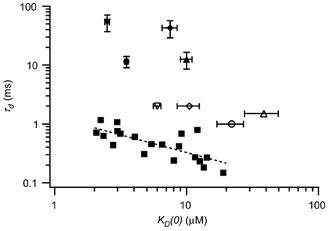
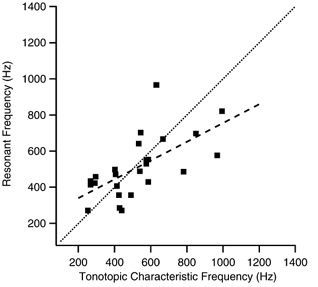
The mechanism for electrical tuning in non-mammalian hair cells rests within the widely diverse kinetics of functionally distinct, large-conductance potassium channels (BK), thought to result from alternative splicing of the pore-forming alpha subunit and variable co-expression with an accessory beta subunit. Inside-out patches from hair cells along the chicken basilar papilla revealed 'tonotopic' gradations in calcium sensitivity and deactivation kinetics. The resonant frequency for the hair cell from which the patch was taken was estimated from deactivation rates, and this frequency reasonably matched that predicted from the originating cell's tonotopic location. The rates of deactivation for native BK channels were much faster than rates reported for cloned chicken BK channels including both alpha and beta subunits. This result was surprising since patches were pulled from hair cells in the apical half of the papilla where beta subunits are most highly expressed. Heterogeneity in the properties of native chicken BK channels implies a high degree of molecular variation and hinders our ability to identify those molecular constituents.


Figures

Figure 1
Figure 1. Single-channel currents from a hair cell BK channel in the inside-out patch configuration
Single-channel currents are shown at three holding voltages for a patch exposed to 1 (A) and 8.3 μm[Ca2+] (B). In all cases, channel opening is upward. C, open probability (Po) was fitted with a single Boltzmann function (continuous lines) for each calcium concentration (indicated by numbers adjacent to curves, in μm). D, half-activating voltage (V1/2)from the Boltzmann fits is shown and fitted across the tested calcium concentrations using a logarithmic relationship predicted by a simple two-state model. The calcium concentration required for half-activation at 0 mV, KD(0), was determined to be 3.2 μm. E, current amplitude is plotted against holding voltage. Data from four separate calcium conditions are included in this plot. The curve fit (dashed line) indicates a single-channel conductance of 302 pS. Data in A-E are all from the same patch, taken from a hair cell at 36 % distance from the apical end.
Figure 2
Figure 2. BK channel calcium sensitivity from ensemble-averaged currents
A, leak subtracted activation currents are shown for a single patch in three separate calcium conditions. Voltage protocols are shown above each set of current traces, each of which is the average of 50 stimulus presentations. In this protocol, the patch was initially stepped from a holding potential of 0 mV to −100 mV, closing any open channels. Activation voltages ranged from −40 mV to 120 mV in 1 and 5 μm[Ca2+], and from −80 mV to 80 mV in 20 μm[Ca2+]. This patch contained three BK channels and was taken from a hair cell located at 48.5 % distance from the apical end. B, conductance-voltage curves are plotted for the patch shown in A. Conductance was calculated from the steady-state current averaged over the final 10 ms of the activation commands. G/Gmax curves were fitted using single Boltzmann functions. Numbers placed next to some curves indicate extremes of tested calcium concentrations. Calcium concentrations: □, 1 μm; •, 2 μm; ▵, 5 μm; ♦, 20 μm; ○, 50 μm; ▪, 100 μm. C, G/Gmax curves for a second patch with approximately three BK channels from a hair cell located 41.5 % distance from the apical end. Calcium concentrations: □, 1 μm; •, 2 μm; ▵, 5 μm; ♦, 20 μm; ○, 50 μm. D, half-activating voltages were fitted with logarithmic relationships to [Ca2+], indicating a KD(0) for the patch in B (○) of 11.6 μm and that in C (▪) of 0.4 μm, respectively. E, calcium sensitivity for each patch, expressed as KD(0), is plotted according to the location from which that patch was taken along the basilar papilla: ▪, ensemble-averaged data from multi-channel patches; □, single-channel recordings.
Figure 3
Figure 3. Calcium binding parameters along the sensory epithelium
A, calcium sensitivity is plotted at holding potentials of −50 mV and +50 mV. These data were derived from logarithmic fits to V1/2-[Ca2+] curves, predicted by a two-state model. In many cases, it was necessary to extrapolate from these fits to estimate KD (23 % of patches for −50 mV and 42 % for +50 mV). The calcium concentration required for half-activation near the resting potential of the hair cell membrane ranges between approximately 5 and 100 μm. Dashed lines indicate exponential curve fits to the data of the form KD=A exp((%DAE)/B), where %DAE is the percentage distance from the apical end. Fit parameters: for +50 mV, A= 0.16, B= 24.3; for −50 mV, A= 8.2, B= 32.7. B, the energy consumed in the calcium binding process (δ) was estimated from the two-state model fits. This parameter was not tonotopically distributed.
Figure 4
Figure 4. Gating charge (q) from Boltzmann fits to activation curves
A, gating charge was averaged for all patches and plotted according to calcium concentration. Channels were less voltage sensitive at higher calcium concentrations. Gating charge is also plotted against the tonotopic location of each patch, when exposed to 2 (B) and 20 μm[Ca2+](C). For lower calcium concentrations as in B, channels from apical locations were more voltage sensitive than channels from basal locations. This tonotopic gradient was not evident in higher calcium concentrations, as in C. Dashed lines represent linear regressions to the data.
Figure 5
Figure 5. Channel activation rate is calcium and voltage dependent, but is not dependent on tonotopic location
A, example traces are shown for leak-subtracted, ensemble-averaged currents from activation protocols including a −100 mV pre-pulse and activation to −40, 40 or 80 mV. Activation rates increase with voltage and calcium concentration. These examples are similar to those in Fig. 2A, but in this case the patch contains a single BK channel from a hair cell located 22.3 % distance from the apical end. B, for the patch in A, the time constant for activation (τa) is shown at various command voltages and calcium concentrations. This time constant was derived from single exponential fits to the ensemble current. Dashed lines represent curve fits to τa=A exp(-(qf FV/RT)). Fit parameters for each [Ca2+]: □, 1 μm, A= 14.8, qf= 0.50; •, 2 μm, A= 9.3, qf= 0.47; ▵, 5 μm, A= 5.2, qf= 0.51; ♦, 20 μm, A= 3.2, qf= 0.55. C, the time constant for activation, for a constant voltage (60 mV) and calcium concentration (5 μm), is plotted according to the tonotopic location of the patch. There was no tonotopic distribution of activation rates. This observation was true for other voltage and calcium conditions as well.
Figure 6
Figure 6. Channel deactivation rate is calcium and voltage dependent and varies with tonotopic location
A, normalized, leak-subtracted, ensemble-averaged currents are shown for a patch containing approximately three channels and taken from a hair cell at 35.5 % distance from the apical end. The patch was stepped to deactivating voltages of −20 to −100 mV, following activation to 100 mV. Each trace represents the average from 50 stimulus presentations. Current relaxation was faster for more negative voltages. B, the time constant for deactivation (τd) was derived from single exponential fits to the relaxation currents and plotted against the deactivation voltage command. Numbers next to each curve indicate the calcium concentration presented to the patch. The time constant increased e-fold in approximately 60 mV, regardless of calcium concentration. Dashed lines represent fits to τd=A exp(qb FV/RT). Fit parameters for each [Ca2+]: □, 1 μm, A= 2.0, qb= 0.41; •, 5 μm, A= 4.6, qb= 0.41; ▵, 20 μm, A= 13.1, qb= 0.43. C, normalized currents are shown for a patch activated to 100 mV and then stepped to a deactivation voltage of −100 mV, while exposed to various calcium concentrations. Each trace represents the average of 80–100 stimulus presentations. Current relaxation was slower when the patch was exposed to higher calcium concentrations. D, time constants for deactivation to −100 mV are shown as a function of calcium concentration and fitted with a logarithmic relationship. A-D, all from the same patch. The dashed line represents a curve fit to τd=A ln([Ca2+]) +B. Fit parameters: A= 0.34 and B= 0.17. E, τd at 4 μm[Ca2+] and −100 mV is tonotopically distributed with faster deactivation rates for patches from hair cells from the high frequency end of the papilla.
Figure 7
Figure 7. Native BK channel properties differ from those of cloned channels
Deactivation time constant at 5 μm[Ca2+] and −100 mV is plotted against calcium sensitivity, KD(0), for hair cell patches with native BK channels (▪) and patches of cloned channels from cslo cDNAs (4 splice variants of the α subunit, with and without the avian β subunit; ○, α0; ▵, α4; ▿, α61; ⋄, α4–61–28; •, α0β; ▴, α4β; ▾, α61β; ♦, α4–61-28β). The dashed line represents a curve fit to the data from native channels, τd= 1.3(KD(0))- 0.60. Data from clones of the chicken BK channel cDNA were taken from Ramanathan et al. (2000). Although there is essentially no overlap, for both native and cloned channels the more calcium-sensitive patches deactivated more slowly. Error bars for data from cloned channels indicate one s.e.m. Vertical error bars for the α-only variants were extremely small and thus excluded from the graph.
Figure 8
Figure 8. Estimates of resonant frequency match characteristic frequency according to tonotopic location
The resonant frequency for a hair cell expressing only those channels found in the inside-out patch was estimated using data collected from turtle hair cells (Art & Fettiplace, 1987; Wu et al. 1995) and corrected for effects of temperature. The characteristic frequency for the tonotopic position of the hair cell from which the patch was taken was calculated from the map of Jones & Jones (1995). Matched resonant and characteristic frequencies would fall along a line of identity (dotted line). A least-squares, linear regression fit to the data (dashed line) gave a slope of 0.52.

Similar articles

Cited by

References

    1. Art JJ, Fettiplace R. Variation of membrane properties in hair cells isolated from the turtle cochlea. J Physiol. 1987;385:207–242. - PMC - PubMed
    1. Art JJ, Wu YC, Fettiplace R. The calcium-activated potassium channels of turtle hair cells. J Gen Physiol. 1995;105:49–72. - PMC - PubMed
    1. Atkinson NS, Robertson GA, Ganetzky B. A component of calcium-activated potassium channels encoded by the Drosophila slo locus. Science. 1991;253:551–555. - PubMed
    1. Bers DM, Patton CW, Nuccitelli R. A practical guide to the preparation of Ca2+ buffers. Methods Cell Biol. 1994;40:3–29. - PubMed
    1. Butler A, Tsunoda S, McCobb DP, Wei A, Salkoff L. mSlo, a complex mouse gene encoding ‘maxi’ calcium-activated potassium channels. Science. 1993;261:221–224. - PubMed

Publication types

MeSH terms

Substances

LinkOut - more resources