. 2003 Mar 1;547(Pt 2):373-85.
doi: 10.1113/jphysiol.2002.033076. Epub 2003 Jan 10.

Allosteric regulation and spatial distribution of kainate receptors bound to ancillary proteins

Affiliations

Allosteric regulation and spatial distribution of kainate receptors bound to ancillary proteins

Derek Bowie et al. J Physiol. .

Abstract

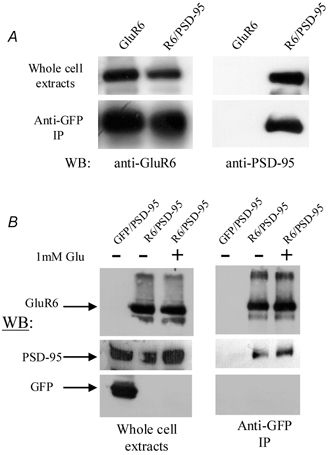
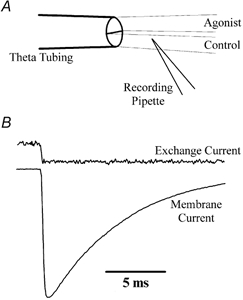
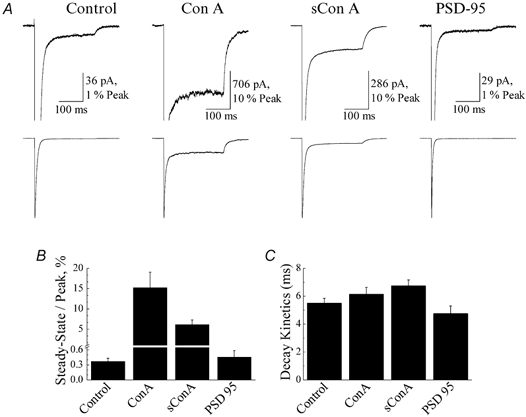
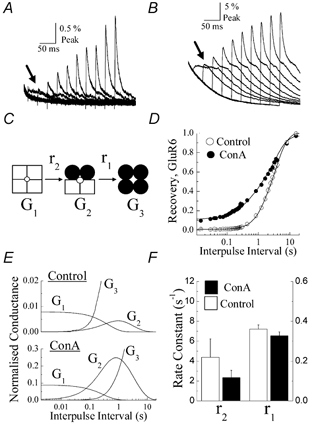
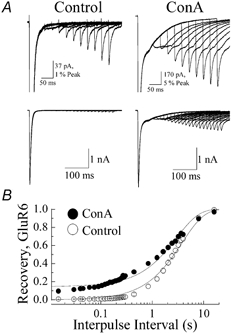
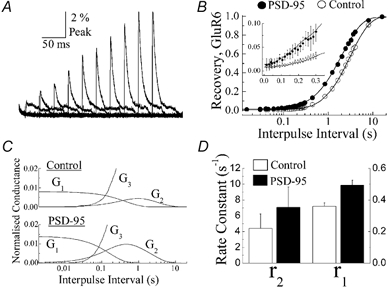
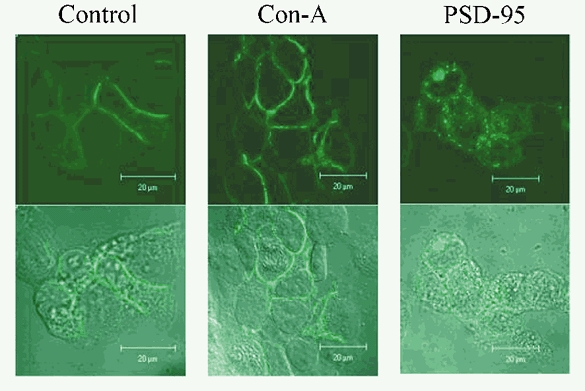
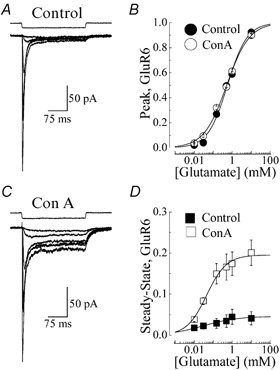
A diverse range of accessory proteins regulates the behaviour of most ligand- and voltage-gated ion channels. For glutamate receptor 6 (GluR6) kainate receptors, two unrelated proteins, concanavalin-A (Con-A) and postsynaptic density protein 95 (PSD-95), bind to extra- and intracellular domains, respectively, but are reported to exert similar effects on GluR6 desensitization behaviour. We have tested the hypothesis that distinct allosteric binding sites control GluR6 receptors via a common transduction pathway. Rapid agonist application to excised patches revealed that neither Con-A nor PSD-95 affect the onset of desensitization. The rate of desensitization elicited by 10 mM L-glutamate was similar in control (taufast = 5.5 +/- 0.4 ms), Con-A-treated patches (taufast = 6.1 +/- 0.5 ms) and patches containing PSD-95 and GluR6 receptors (taufast = 4.7 +/- 0.6 ms). Likewise, the time course of recovery from GluR6 desensitization was similar in both control and Con-A conditions, whereas PSD-95 accelerated recovery almost twofold. Peak and steady-state (SS) dose-response relationships to glutamate were unchanged by lectin treatment (e.g. control, EC50(SS) = 31 +/- 28 microM vs Con-A, EC50(SS) = 45 +/- 9 microM, n = 6), suggesting that Con-A does not convert non-conducting channels with high agonist affinity into an open conformation. Instead, we demonstrate that the effects of Con-A on macroscopic responses reflect a shift in the relative contribution of different open states of the channel. In contrast, the effect of PSD-95 on recovery behaviour suggests that the association between kainate receptors and cytoskeletal proteins regulates signalling at glutamatergic synapses. Our results show that Con-A and PSD-95 regulate kainate receptors via distinct allosteric mechanisms targeting selective molecular steps in the transduction pathway.


Figures

Figure 8
Figure 8. PSD-95 and receptor activation do not affect the surface expression of GluR6 kainate receptors
A, Western blots (WB) illustrating the effect of PSD-95 on the surface expression of GluR6 kainate receptors. Upper left panel: lysates of human embryonic kidney (HEK) 293T cells previously transfected with cDNA for GluR6 alone or with PSD-95 and probed with anti-GluR6 antibody. The immunoreactive bands were of similar intensity, demonstrating that the total amount of GluR6 extracted from each cell culture was similar. Lower left panel: bands immunoreactive to anti-GluR6 antibody obtained from co-immunoprecipitation experiments were also similar, suggesting that PSD-95 does not affect surface expression of GluR6. Upper right panel: lysates of HEK 293T cells probed with anti-PSD-95 antibody show that only cells transfected with PSD-95 exhibit immunoreactivity. Lower right panel: PSD-95 immunoreactive band co-immunoprecipitated with anti-GluR6 antibody reveals that the majority of plasma membrane bound GluR6 receptors are associated with PSD-95. In cells transfected with cDNA for GluR6 alone, immunoreactivity to anti-PSD-95 antibody is absent. B, Western blots showing the effect of kainate receptor activation on the surface expression of GluR6. Left panel: lysates of HEK 293T cells expressing GluR6 alone or in combination with PSD-95 probed with anti-GluR6, PSD-95 and GFP antibodies. The right-hand lane shows immunoreactivity of HEK 293T cells challenged with 1 mm l-glutamate for 5 min before whole-cell extraction. Right panel: immunoreactive bands to anti-GluR6 and PSD-95 antibodies obtained in a pull-down assay to determine the surface expression of GluR6 receptors. The right-hand lane shows immunoreactivity of HEK 293T cells challenged with 1 mm l-glutamate for 5 min before co-immunoprecipitation.
Figure 1
Figure 1. Rapid perfusion of agonist solutions to excised membrane patches
A, schematic diagram of a routine experiment showing the orientation of the theta tubing and recording pipette containing an outside-out membrane patch. To achieve rapid solution exchange of excised patches, both control and agonist solutions were fed continuously by gravity and the tip of the recording pipette was placed close to the control-agonist solution interface. The solution was rapidly exchanged by displacement of the theta tubing using a piezoelectric stack (Physik Instrumente). B, typical exchange and membrane currents recorded from the same patch recording (patch no. 010712p1). The solution exchange rate was determined routinely at the end of each experiment by measuring the current between the solution containing 10 mm l-glutamate and the control solution, in which the total Na+ content was reduced by 5 %.
Figure 2
Figure 2. Concanavalin-A (Con-A) but not postsynaptic density protein 95 (PSD-95) affects glutamate receptor (GluR)6 steady-state desensitization
A, typical membrane currents evoked by 10 mm glutamate (250 ms duration, holding potential (VH) =−20 mV) on outside patches expressing GluR6 receptors alone (left panel, patch no. 010712p1), co-expressed with PSD-95 (right panel, patch no. 010619p1) or following treatment with 10 μm Con-A (patch no. 000327p2) and 10 μm succinyl Con-A (sCon-A; patch no. 010713p2). B and C, plots summarizing the effect of lectin treatment and co-expression of PSD-95 on GluR6 steady-state responses (B) and the fast kinetic component of desensitization (C). All data are expressed as the mean ±s.e.m.
Figure 6
Figure 6. Con-A shifts the relative contribution of conducting states
A and B, ten normalized test responses taken from Fig. 5A and detailed to show their temporal profile before (A) and after (B) Con-A treatment. Note that during the early phase of the recovery process in both cases, test responses re-enter desensitization with slower kinetics (see arrows). C, schematic showing only the recovery steps in the dimer model of GluR6 desensitization. G1, G2 and G3 are the macroscopic conductances associated with different states of the kinetic model and r2 and r1 are the rate constants that describe the rate of recovery from desensitization. The transition steps that lead from state G3 to state G1 have been omitted since Con-A treatment did not affect GluR6 desensitization kinetics (see Fig. 2). D, data from Fig. 5B re-fitted assuming that GluR6 receptors recover from desensitization in two sequential steps as shown in C. E, plots summarizing the contribution of conducting states G1-G3 to the macroscopic response at a range of interpulse intervals in control conditions (upper panel) and following Con-A treatment (lower panel). Note that the scale of the ordinate axis in the lower plot is an order of magnitude larger. F, summary plot showing the values of rate constants r1 and r2 estimated from fits of control and Con-A data shown in D.
Figure 5
Figure 5. Recovery from GluR6 desensitization does not display first-order kinetics
A, paired conditioning and test responses evoked by 10 mm l-glutamate (50 ms duration, VH=−20 mV, patch no. 010403p2) in the same recording before (left panels) and after (right panels) treatment with 10 μm Con-A. The lower row shows 20 paired conditioning and test responses in each condition separated by interpulse intervals with 15 ms increments. The upper row shows every alternate pair at higher gain to allow visual inspection of the amplitude and decay behaviour of individual test responses B, plot summarizing the effect of Con-A on recovery from GluR6 desensitization. Open and filled circles denote the test response amplitude at any given interpulse interval before and after Con-A treatment, respectively. To show the early phase of the recovery process, the time axis has been plotted on a logarithmic scale. In each case, the recovery process was fitted by the expression It=Ipeak× (1 - exp(-trec)) +Iss, where It is the response amplitude at any time (t), Ipeak is the peak test response, Iss is the steady-state response (constrained to zero in control) and τrec is the time constant for recovery. All data are expressed as the mean ±s.e.m. Note that recovery behaviour in each condition was poorly fitted by a monoexponential function.
Figure 7
Figure 7. PSD-95 accelerates recovery from GluR6 receptor desensitization
A, ten normalized test responses observed when GluR6 receptors were co-expressed with PSD-95 (1:10 ratio). As noted for control and Con-A conditions, test responses re-enter desensitization with slower kinetics during the early phase of recovery. B, summary plots comparing recovery of GluR6 responses from desensitization in control conditions (open circles) and with PSD-95 (filled circles). The time axis is plotted on a logarithmic scale to show the early phase of the recovery process. Insert: plot of the early phase of the recovery process showing that GluR6 channels recover faster from desensitization in the presence of PSD-95. The time axis is plotted on a linear scale. C, plots showing the contribution of conducting states G1-G3 to the macroscopic response for GluR6 receptors alone (upper panel) or when co-expressed with PSD-95 (lower panel). D, summary plot showing the values of rate constants r1 and r2 estimated from fits of data shown in B.
Figure 3
Figure 3. Con-A does not redistribute kainate receptors on the plasma membrane
Spatial distribution of green fluorescent protein (GFP)-tagged GluR6 (GFP-GluR6) receptors visualized using fluorescence confocal microscopy in control conditions (left panels), following 5 min of treatment with 10 μm Con-A (middle panels) or in cells co-expressing PSD-95 (right panels). The upper row shows confocal images of GFP fluorescence and the lower row denotes the same cells in transmitted light, using digital interference contrast. The spatial distribution of GFP-GluR6 receptors was similar in control conditions and following Con-A treatment, but co-expression with PSD-95 induced a punctate appearance of the plasma membrane and cytoplasmic expression of kainate receptors.
Figure 4
Figure 4. Con-A does not affect GluR6 dose-response relationships
A and C, typical membrane currents elicited by l-glutamate (5 μm-10 mm, VH=−20 mV, 250 ms duration) in the same recording (patch no. 001002p1) before (A, peak EC50= 458 μm, nH= 0.91) and after (C, peak EC50= 512 μm, nH= 0.78) treatment with 10 μm Con-A. B and D, peak and steady-state GluR6 dose-response relationships observed prior to (filled circle or square, n= 6) and following (open circle or square, n= 5) Con-A treatment and fitted with the logistic equation (continuous lines): R=Imax/(1 + EC50/[agonist]nH) where R is the peak or steady-state response at a given agonist concentration, Imax is the maximum response and nH denotes the Hill coefficient. To allow comparison amongst different patches, peak and steady-state amplitudes were normalized with Imax values obtained from fits of individual dose-response relationships. Response rundown was not appreciable in control and Con-A-treated patches. However, to minimize this effect, all dose-response relationships were constructed by alternating between high and low agonist concentrations. All data are expressed as the mean ±s.e.m.

Similar articles

Cited by

References

    1. Armstrong N, Gouaux E. Mechanisms for activation and antagonism of an AMPA-sensitive glutamate receptor: crystal structures of the GluR2 ligand binding core. Neuron. 2000;28:165–181. - PubMed
    1. Armstrong N, Sun Y, Chen G-Q, Gouaux E. Structure of a glutamate-receptor ligand-binding core in complex with kainate. Nature. 1998;395:913–917. - PubMed
    1. Bähring R, Bowie D, Benveniste M, Mayer ML. Permeation and block of rat GluR6 glutamate receptor channels by internal and external polyamines. J Physiol. 1997;502:575–589. - PMC - PubMed
    1. Bowie D. External anions and cations distinguish between AMPA and kainate receptor gating mechanisms. J Physiol. 2002;539:725–733. - PMC - PubMed
    1. Bowie D, Lange GD. Functional stoichiometry of glutamate receptor desensitization. J Neurosci. 2002;22:3392–3403. - PMC - PubMed

Publication types

LinkOut - more resources