. 2003 Mar 1;547(Pt 2):405-16.
doi: 10.1113/jphysiol.2002.030684. Epub 2003 Jan 17.

Somatic exocytosis of serotonin mediated by L-type calcium channels in cultured leech neurones

Affiliations

Somatic exocytosis of serotonin mediated by L-type calcium channels in cultured leech neurones

Citlali Trueta et al. J Physiol. .

Abstract

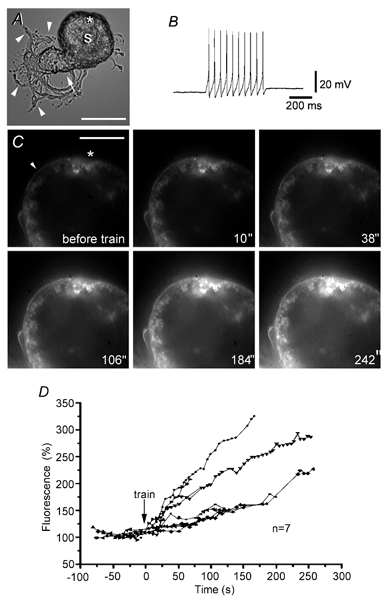
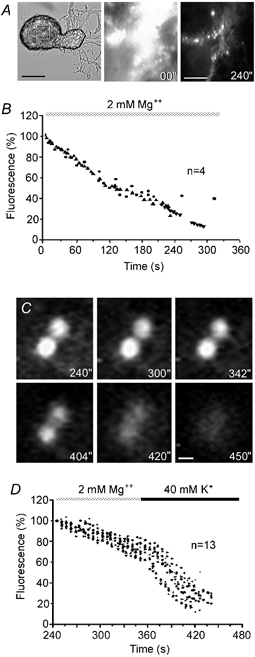
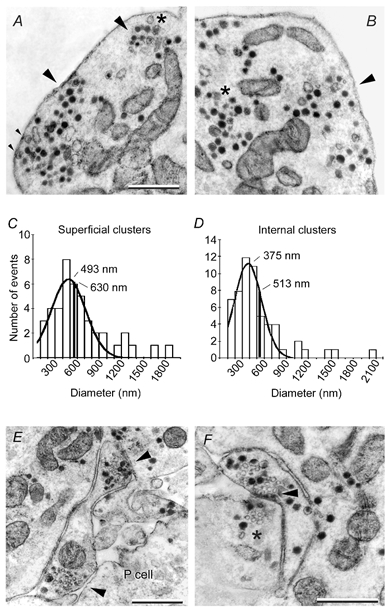
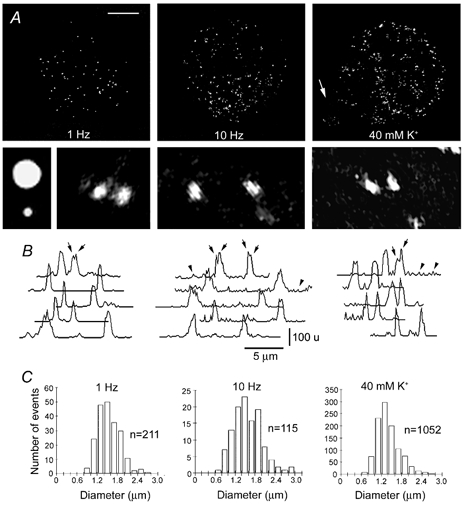
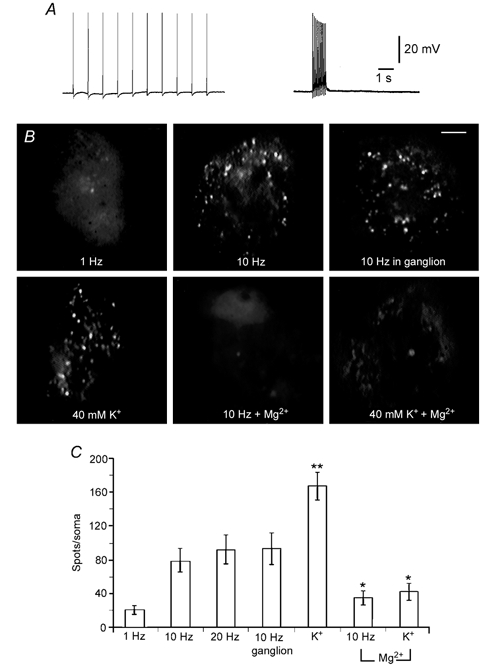
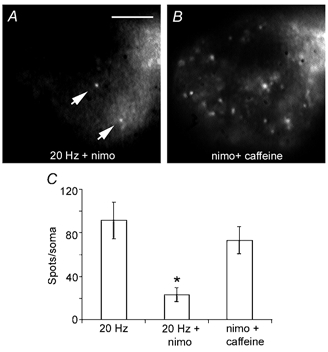
We studied somatic exocytosis of serotonin and its mediation by L-type calcium (Ca2+) channels in cultured Retzius neurones of the leech. Exocytosis was induced by trains of impulses at different frequencies or by depolarisation with 40 mM potassium (K+), and was quantified by use of the fluorescent dye FM 1-43. Stimulation increased the membrane fluorescence and produced a pattern of FM 1-43 fluorescent spots of 1.28 +/- 0.01 microm in diameter, provided that Ca2+ was present in the bathing fluid. Individual spots lost their stain during depolarisation with 40 mM K+. Electron micrographs showed clusters of dense core vesicles, some of which were in contact with the cell membrane. Presynaptic structures with clear vesicles were absent from the soma. The number of fluorescent spots per soma, but not their diameter or their fluorescence intensity, depended on the frequency of stimulation. Trains at 1 Hz produced 19.5 +/- 5 spots per soma, 77.9 +/- 13.9 spots per soma were produced at 10 Hz and 91.5 +/- 16.9 spots per soma at 20 Hz. Staining patterns were similar for neurones in culture and in situ. In the presence of the L-type Ca2+ channel blocker nimodipine (10 microM), a 20 Hz train produced only 22.9 +/- 6.4 spots per soma, representing a 75 % reduction compared to control cells (P < 0.05). Subsequent incubation with 10 mM caffeine to induce Ca2+ release from intracellular stores increased the number of spots to 73.22 +/- 12.5. Blockers of N-, P-, Q- or invertebrate Ca2+ channels did not affect somatic exocytosis. Our results suggest that somatic exocytosis by neurones shares common mechanisms with excitable endocrine cells.


Figures

Figure 1
Figure 1. Electrical stimulation increases somatic FM 1–43 fluorescence in Retzius neurones
A, phase contrast micrograph of a Retzius neurone in culture showing the soma (S) attached to the stump (arrow). Neurites and growth cones are marked with arrowheads. Scale bar represents 60 μm. B, intracellular recording of the 20 Hz train produced by current injection.C, fluorescence images of a selected somatic region of the same Retzius neurone before and after the 20 Hz train in the presence of 2 μm FM 1–43. The time after stimulation is shown in each image (′′ indicates seconds). Note the gradual increase in fluorescence. The arrowhead points to a membrane area used to measure fluorescence over time. The asterisk marks a region with debris which was excluded from the analysis. Scale bar represents 30 μm. D, fluorescence increase of a selected membrane area of 7 neurones before and after stimulation. Continuous lines link symbols representing data from individual neurones.
Figure 2
Figure 2. Fluorescent FM 1–43 spotted pattern of Retzius neurones
A, phase contrast of a Retzius neurone and fluorescence images of the selected area of the soma membrane at different times after electrical stimulation with a 20 Hz train in the presence of FM 1–43. Fluorescence images were taken at the beginning (00′′) and after 240 s of perfusion with Mg2+ solution. Washing the non-specific FM 1–43 staining off the membrane revealed fluorescent spots. Scale bars represent 60 μm (phase contrast) and 10 μm (fluorescence), respectively. B, decay of fluorescence in selected somatic membrane areas of 4 neurones during perfusion with Mg2+ solution to wash off non-specific FM 1–43 staining. Series of data from 4 neurones are superimposed. C, fluorescent FM 1–43 spots imaged at different times during perfusion with Mg2+ solution (top three images) and during depolarisation with 40 mm K+, 10 mm Ca2+ solution (bottom three images). Depolarisation in the presence of Ca2+ destained the fluorescent spots rapidly. The times shown are contiguous with those in A and B. Scale bar represents 1 μm. D, decay of FM 1–43 fluorescence intensity during superfusion with Mg2+ solution followed by depolarisation with 40 mm K+, 10 mm Ca2+ solution. The perfusion protocol is above. Series of data from 12 spots in 3 neurones are superimposed.
Figure 3
Figure 3. Subcellular distribution of structures possibly representing secretory organelles
A, electron micrograph showing subcellular somatic clusters of dense core vesicles (arrowheads) and mitochondria. Clusters near the cell membrane with vesicles making contact with it are marked with small arrowheads. Presynaptic densities were absent. A large clear vesicle is marked with an asterisk. B, in addition to the vesicle clusters near the cell membrane (arrowhead) other clusters were at a distance from it (asterisk). Scale bar in A also applies to B. C, diameter distribution of superficial clusters. The continuous line is a Gaussian fit to the data with a mean value of 493 ± 35 nm. The black vertical line is the average diameter of the whole population. D, similar analysis for clusters at distances larger than 150 nm from the cell membrane. E, micrograph of the contact region with a pressure sensory (P cell) neurone showing a process of the Retzius neurone with two groups of clear and dense core vesicles near the cell membrane (arrowheads). F, autapse formed by a process and the stump of a Retzius neurone. A dense presynaptic zone with clear and dense core vesicles (arrowhead) is in close apposition to the cell membrane. A cluster of vesicles in the stump is marked with an asterisk. Scale bars represent 1 μm in all cases.
Figure 4
Figure 4. FM 1–43 staining patterns of Retzius neurones
A, confocal three-dimensional (3-D) reconstructions of Retzius neurones stimulated in the presence of FM 1–43. The stimulation protocol is stated in each image. The arrow points to the stump. Scale bar represents 30 μm. Below are shown (left to right) amplified fluorescence images of fluorescent beads with 2.0 and 0.5 μm diameters and FM 1–43 spots of the neurones stimulated with each protocol. Note the asymmetries of the spots. B, light intensity profiles of several spots in each of the neurones above. The top traces correspond to the spots shown in the images. Different light intensity peaks in each spot were common (arrows). Intensities are in an arbitrary 256 unit (u) grey scale. Note the increase of the baseline noise in the profiles of neurones stimulated with 10 Hz and with high K+ (arrowheads). C, histograms of the diameter distribution of FM 1–43 spots obtained from confocal images of different cells stimulated with each protocol.
Figure 5
Figure 5. Frequency and Ca2+ dependence of FM 1–43 staining
A, intracellular recordings of trains of action potentials at 1 and 10 Hz, respectively, produced by intracellular current injection. B, staining pattern of neurones stimulated with the different protocols indicated in each image. The staining patterns of neurones stimulated in culture or in the ganglion were similar. Substituting Mg2+ for Ca2+ prevented FM 1–43 staining in neurones stimulated with a 10 Hz train or with 40 mm K+. Fluorescence images are non-confocal and were taken at comparable focal planes at the site of contact with the plate. Scale bar represents 10 μm. C, quantification of the total number of spots per soma under the different stimulation conditions shown in B. * Significant (P < 0.05) differences with respect to neurones stimulated in the presence of Ca2+. The number of spots per soma in neurones depolarised with 40 mm K+ was significantly (P < 0.05) larger than in neurones stimulated with microelectrodes (**).
Figure 6
Figure 6. Blockade of somatic secretion by nimodipine
A, fluorescence image of a Retzius neurone stimulated with a 20 Hz train in the presence of 10 μm nimodipine (nimo) and FM 1–43. Only a few spots can be seen (arrows). Scale bar represents 20 μm. B, subsequent incubation with 10 mm caffeine in the presence of FM 1–43 increased the number of fluorescent spots. The focal plane of the neurone is the same as in A. Note that the spots in A are also present in B. C, number of spots produced by the stimulation conditions in A and B, compared with control neurones stimulated with a 20 Hz train.

Similar articles

Cited by

References

    1. Ämmälä C, Eliasson L, Bokvist K, Larsson O, Ashcroft FM, Rorsman P. Exocytosis elicited by action potentials and voltage-clamp calcium currents in individual mouse pancreatic B-cells. J Physiol. 1993;472:665–688. - PMC - PubMed
    1. Angleson JK, Cochilla AJ, Kilic G, Nussinovitch I, Betz WJ. Regulation of dense core release from neuroendocrine cells revealed by imaging single exocytic events. Nat Neurosci. 1999;2:440–446. - PubMed
    1. Artalejo CR, Adams ME, Fox AP. Three types of Ca2+ channel trigger secretion with different efficacies in chromaffin cells. Nature. 1994;367:72–76. - PubMed
    1. Augustine GJ, Neher E. Calcium requirements for secretion in bovine chromaffin cells. J Physiol. 1992;450:247–271. - PMC - PubMed
    1. Beck A, Lohr C, Deitmer JW. Calcium transients in subcompartments of the leech Retzius neuron as induced by single action potentials. J Neurobiol. 2001;48:1–18. - PubMed

Publication types

LinkOut - more resources