

Glycinergic mIPSCs in mouse and rat brainstem auditory nuclei: modulation by ruthenium red and the role of calcium stores
- PMID: 12562997
- PMCID: PMC2342600
- DOI: 10.1113/jphysiol.2002.035071
Glycinergic mIPSCs in mouse and rat brainstem auditory nuclei: modulation by ruthenium red and the role of calcium stores
Abstract
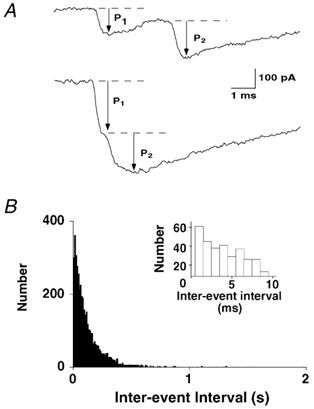
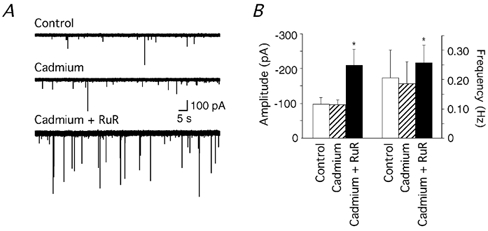
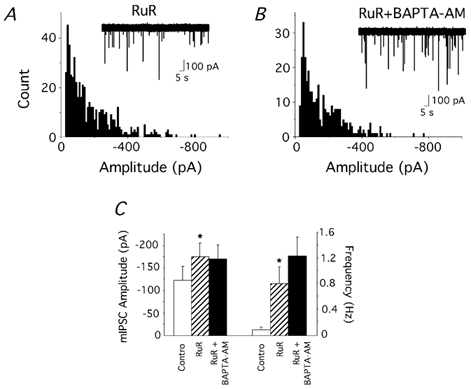
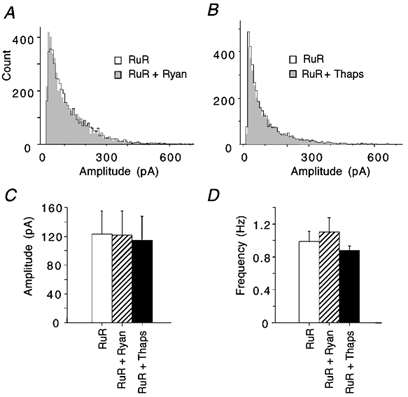
Spontaneous miniature inhibitory postsynaptic currents (mIPSCs) recorded in central neurons are usually highly variable in amplitude due to many factors such as intrinsic postsynaptic channel fluctuations at each release site, site-to-site variability between release sites, electrotonic attenuation due to variable dendritic locations of synapses, and the possibility of synchronous multivesicular release. A detailed knowledge of these factors is essential for the interpretation of mIPSC amplitude distributions and mean quantal size. We have studied glycinergic mIPSCs in two auditory brainstem nuclei, the rat anteroventral cochlear nucleus (AVCN) and the mouse medial nucleus of the trapezoid body (MNTB). Our previous results have demonstrated the location of glycinergic synapses on these neurons to be somatic, thus avoiding electrotonic complications. Spontaneous glycinergic mIPSCs were recorded from AVCN and MNTB neurons in brainstem slices, in the presence of TTX to block action potentials, and 6-cyano-7-nitroquinoxaline-2, 3-dione, (+/-)-2-amino-5-phosphonopentanoic acid and bicuculline to block glutamatergic and GABAergic synaptic currents. Ruthenium red (RuR), which was used to increase the frequency of mIPSCs, significantly changed the shape of most (90 %) mIPSC amplitude distributions by increasing the proportion of large-amplitude mIPSCs. The possibility was investigated (following previous evidence at GABAergic synapses) that large-amplitude glycinergic mIPSCs are due to synchronous multivesicular release initiated by presynaptic calcium sparks from ryanodine-sensitive calcium stores. Interval analysis of mIPSCs indicated that the number of potentially undetected (asynchrony < 0.5 ms) multivesicular mIPSCs was low in comparison with the number of large-amplitude mIPSCs. Ryanodine, thapsigargin and calcium-free perfusate did not reduce the frequency of large-amplitude mIPSCs (> 150 pA), arguing against a significant role for presynaptic calcium stores. Our results support previous evidence suggesting that RuR increases miniature postsynaptic current (mSC) frequency by a mechanism that does not involve presynaptic calcium stores. Our results also indicate that at glycinergic synapses in the AVCN and MNTB, site-to-site variability in mIPSC amplitude, rather than multivesicular release, is a major factor underlying the large range of amplitudes of glycinergic mIPSCs.
Figures

Similar articles
-
Transition from GABAergic to glycinergic synaptic transmission in newly formed spinal networks.J Neurophysiol. 2001 Jul;86(1):492-502. doi: 10.1152/jn.2001.86.1.492. J Neurophysiol. 2001. PMID: 11431527
-
Differences in glycinergic mIPSCs in the auditory brain stem of normal and congenitally deaf neonatal mice.J Neurophysiol. 2004 Feb;91(2):1006-12. doi: 10.1152/jn.00771.2003. Epub 2003 Oct 15. J Neurophysiol. 2004. PMID: 14561690
-
Contribution of single-channel properties to the time course and amplitude variance of quantal glycine currents recorded in rat motoneurons.J Neurophysiol. 1999 Apr;81(4):1608-16. doi: 10.1152/jn.1999.81.4.1608. J Neurophysiol. 1999. PMID: 10200197
-
The ion channels and synapses responsible for the physiological diversity of mammalian lower brainstem auditory neurons.Hear Res. 2019 May;376:33-46. doi: 10.1016/j.heares.2018.12.011. Epub 2018 Dec 26. Hear Res. 2019. PMID: 30606624 Review.
-
Estimation of quantal parameters at the calyx of Held synapse.Neurosci Res. 2002 Dec;44(4):343-56. doi: 10.1016/s0168-0102(02)00174-8. Neurosci Res. 2002. PMID: 12445623 Review.
Cited by
-
Multiple sources of internal calcium stores mediate ethanol-induced presynaptic inhibitory GABA release in the central nucleus of the amygdala in mice.Psychopharmacology (Berl). 2020 Nov;237(11):3303-3314. doi: 10.1007/s00213-020-05613-w. Epub 2020 Jul 24. Psychopharmacology (Berl). 2020. PMID: 32705289 Free PMC article.
-
Inhibitory control at a synaptic relay.J Neurosci. 2004 Mar 17;24(11):2643-7. doi: 10.1523/JNEUROSCI.5144-03.2004. J Neurosci. 2004. PMID: 15028756 Free PMC article.
-
Alfaxalone Causes Reduction of Glycinergic IPSCs, but Not Glutamatergic EPSCs, and Activates a Depolarizing Current in Rat Hypoglossal Motor Neurons.Front Cell Neurosci. 2019 Mar 22;13:100. doi: 10.3389/fncel.2019.00100. eCollection 2019. Front Cell Neurosci. 2019. PMID: 30967762 Free PMC article.
-
Role of the endoplasmic reticulum in synaptic transmission.Curr Opin Neurobiol. 2022 Apr;73:102538. doi: 10.1016/j.conb.2022.102538. Epub 2022 Apr 5. Curr Opin Neurobiol. 2022. PMID: 35395547 Free PMC article. Review.
-
Glutamate suppresses GABA release via presynaptic metabotropic glutamate receptors at baroreceptor neurones in rats.J Physiol. 2005 Jan 15;562(Pt 2):535-51. doi: 10.1113/jphysiol.2004.076885. Epub 2004 Nov 11. J Physiol. 2005. PMID: 15539399 Free PMC article.
References
-
- Auger C, Marty A. Heterogeneity of functional synaptic parameters among single release sites. Neuron. 1997;19:139–150. - PubMed
-
- Bekkers JM. Quantal analysis of synaptic transmission in the central nervous system. Curr Biol. 1994;4:360–365. - PubMed
-
- Borst JGG, Lodder JC, Kits KS. Large amplitude variability of GABAergic IPSCs in melanotropes from Xenopus laevis: evidence that quantal size differs between synapses. J Neurophysiol. 1994;71:639–655. - PubMed
MeSH terms
Substances
LinkOut - more resources
Full Text Sources