. 2003 Feb 1;546(Pt 3):733-49.
doi: 10.1113/jphysiol.2002.028704.

Oscillations in ciliary beat frequency and intracellular calcium concentration in rabbit tracheal epithelial cells induced by ATP

Affiliations

Oscillations in ciliary beat frequency and intracellular calcium concentration in rabbit tracheal epithelial cells induced by ATP

Luo Zhang et al. J Physiol. .

Abstract

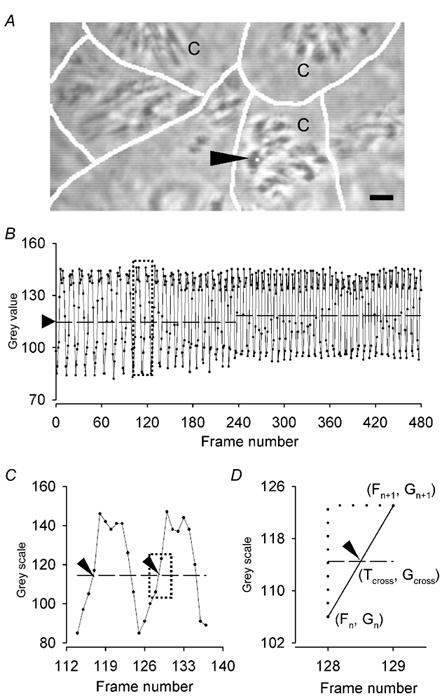
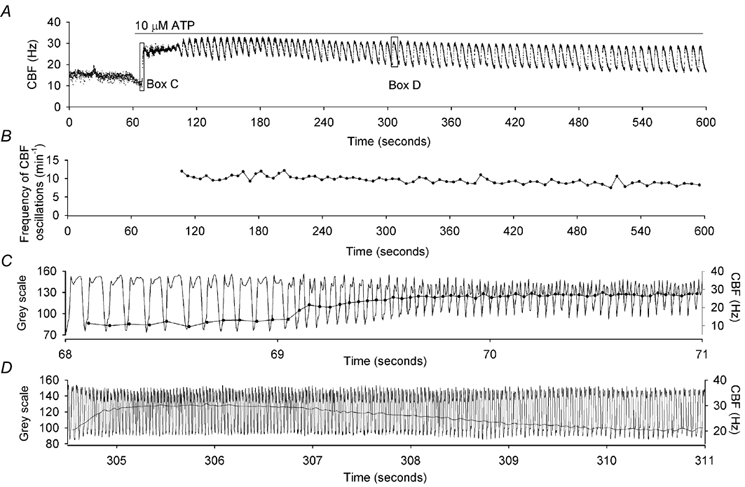
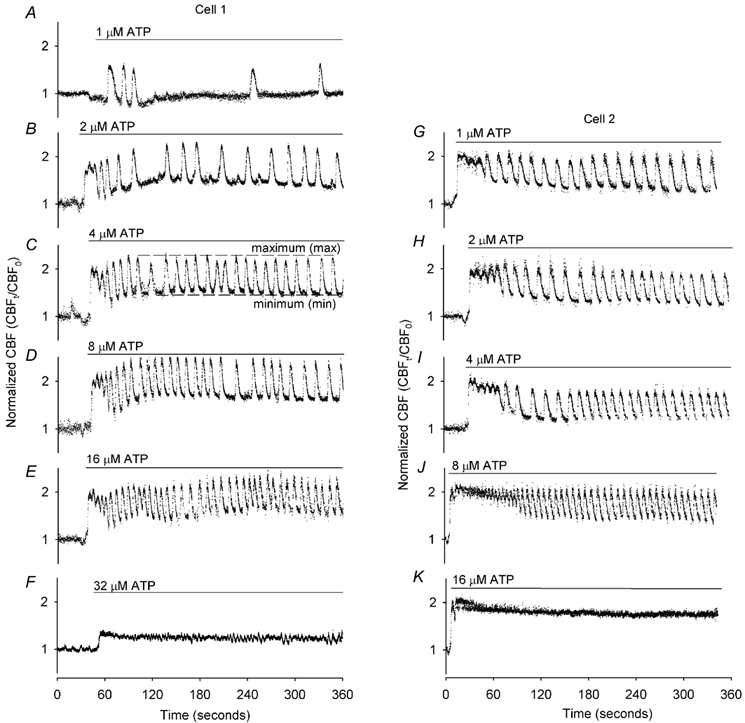
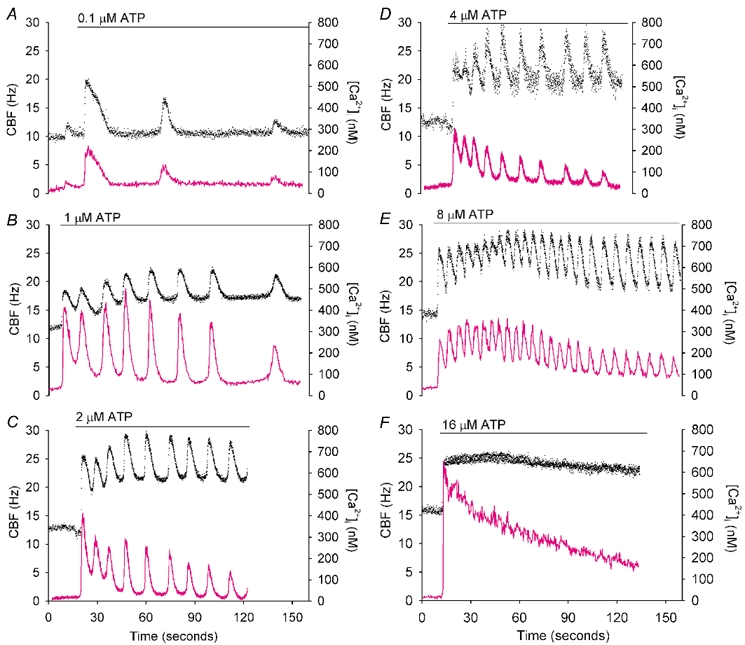
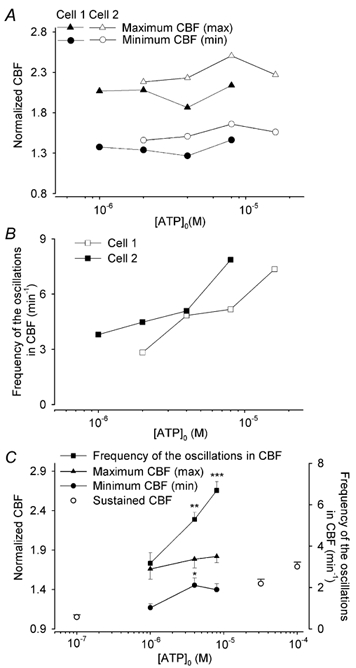
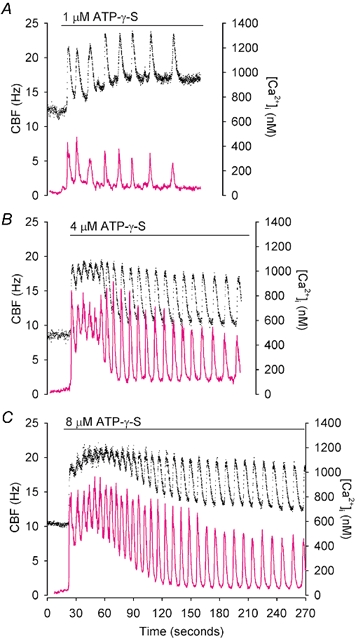
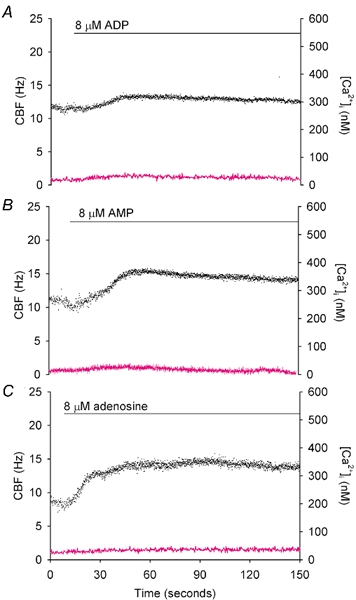
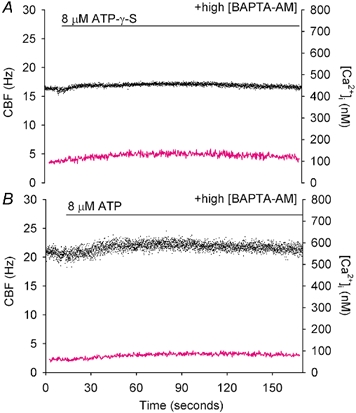
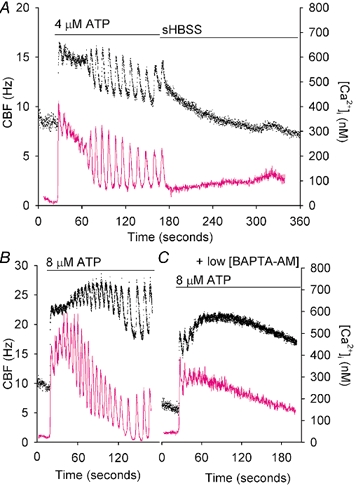
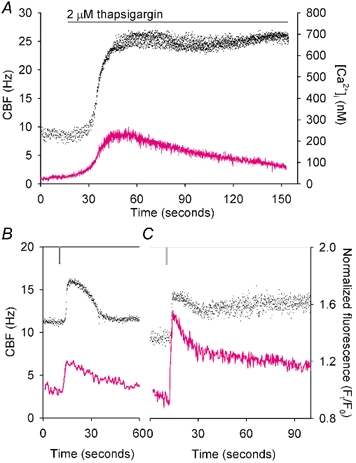
To investigate how Ca(2+) regulates airway ciliary activity, changes in ciliary beat frequency (CBF) and intracellular calcium concentration ([Ca(2+)](i)) of rabbit tracheal ciliated cells, in response to ATP, were simultaneously quantified with high-speed phase-contrast and fast fluorescence imaging. [ATP]<or= 1 microM induced an increase in [Ca(2+)](i) and CBF that declined to the initial basal levels and was followed by irregular brief increases in [Ca(2+)](i) and CBF. [ATP] > 1 but < 16 microM induced a similar increase in [Ca(2+)](i) and CBF but this was followed by oscillations in CBF and [Ca(2+)](i). The minimum CBF of the oscillations in CBF remained elevated above the basal rate while the minimum concentration of the [Ca(2+)](i) oscillations returned to the basal level. The minimum and maximum CBF of the oscillations in CBF were independent of the [ATP], whereas the frequency of the oscillations in CBF was dependent on the [ATP]. Similar oscillations in CBF and [Ca(2+)](i) were induced by ATP- gamma -S. Although ADP, AMP and adenosine induced a Ca(2+)-independent increase in CBF, neither ATP nor ATP- gamma -S induced an increase in CBF when the Ca(2+) increases were abolished by 20 microM BAPTA AM, a result suggesting that ATP hydrolysis was minimal. [ATP] >or=16 microM induced a sustained elevation in CBF and only a temporary, non-oscillating increase in [Ca(2+)](i). A similar response was induced by thapsigargin (2 microM). Flash photolysis of caged Ca(2+) (NP-EGTA) produced both transient and prolonged increases in [Ca(2+)](i) which were accompanied by transient and sustained increases in CBF, respectively. From these results, we propose that CBF can be increased by a direct Ca(2+) -dependent mechanism that generates the rapid increases in CBF associated with the oscillations or by an indirect Ca(2+)-dependent mechanism that is responsible for the sustained minimum increase in CBF.


Figures

Figure 1
Figure 1. Measurement of CBF by digital analysis of the variation in the light intensity of high-speed images
A, a digital phase-contrast image showing several rabbit trachea ciliated epithelial cells in culture. The cilia (C) appear dark and the white lines represent the location of cell borders. The size and position of the region of interest (ROI) from which the CBF was measured is indicated by the white square (arrowhead). Scale bar 5 µm. B, the waveform representing the change in the light or grey intensity of the image at the ROI indicated in A with respect to frame or image number. The points represent the actual data values. The cross-line (arrowhead) is the mid-point between the maximum and minimum grey intensity values of the waveform for each 1 s data segment (horizontal line). C, an expanded view of the dotted box shown in B to illustrate how the time interval (period) between neighbouring cross-points (arrowheads on dashed line) was determined in order to calculate the CBF (1/period). D, an expanded view of the dotted box highlighted in C to illustrate how the precise time of a cross-point (Tcross, Gcross, arrowhead) that occurred between two data values was determined. The changes in grey intensity from one frame to the next (Fn and Fn+1) were assumed to be linear; then, Tcross =[Fn+ (Gcross - Gn)/(Gn+1 - Gn)]/FPS, where FPS is the frame recording rate.
Figure 2
Figure 2. Fast and prolonged changes in CBF were detected by digital high-speed imaging in combination with a beat-by-beat analysis of CBF
A, a representative trace of changes in CBF (•) with respect to time of a rabbit tracheal epithelial cell (in culture for 8 days) in response to 10 µm ATP. The application of ATP elicited a rapid increase in CBF, followed by a prolonged period during which the CBF oscillated. Each dot represents the CBF of each ciliary beat cycle calculated from variation in grey intensity as illustrated in C and D. B, the frequency of the ATP-induced CBF oscillations shown in A (measured oscillation by oscillation) remained relatively constant with respect to time. C, a portion (Box C from A) of the underlying waveform showing the variation in the grey intensity (left axis) with respect to time from which the CBF was calculated. ATP rapidly increased the CBF from ≈13 to ≈28 Hz (continuous line with •, right axis).The symbol (•) represents the CBF of each beat cycle plotted at the end of each beat cycle. D, another portion (Box D from A) of the underlying waveform of the variation in grey intensity at a time when the CBF was oscillating representing one oscillation in CBF. The compression and subsequent relaxation of the waveform represents the increase and decrease in CBF (right axis). During this oscillation, the CBF rapidly increased from ≈20 to 30 Hz and gradually declined back to ≈20 Hz.
Figure 3
Figure 3. Individual variation and range of CBF responses to increasing ATP concentrations displayed by two representative ciliated epithelial cells
Each individual cell was sequentially exposed to a range of [ATP]o (horizontal bars); one cell (Cell 1) was exposed to 1 to 32 µm ATP (A-F), while the second cell (Cell 2) was exposed to 1 to 16 µm ATP (G-K). A, 1 µm ATP elicited an initial transient increase in CBF followed by a few irregular oscillations in CBF. B-E, higher concentrations of ATP induced an initial increase in CBF that was followed by regular periodic oscillations in CBF. The frequency of CBF oscillation increased with increasing ATP concentration. F, relatively high concentrations of ATP (32 µm) induced a sustained elevation in CBF without CBF oscillations. ATP induced a very similar series of responses in CBF in the second example cell (G-K) but, in this cell, each sequential response was induced by lower concentrations of ATP. The basal CBF of these two cells was 14.5 ± 1.4 Hz (n = 6) and 15.0 ± 0.4 Hz (n = 5).
Figure 4
Figure 4. Representative traces of the simultaneous changes in CBF (•) and[Ca2+]i (magenta line) in ciliated epithelial cells in response to ATP (horizontal bars)
A, a transient initial increase in CBF and[Ca2+]i was induced by 0.1 µm ATP, and this was followed by a few irregular oscillations in both and CBF and[Ca2+]i from the basal rate (n = 6 cells). B-E, ATP, ranging from 1 to 8 µm, induced rapid increases in CBF and[Ca2+]i that were followed by oscillations in both CBF and[Ca2+]i. The CBF oscillations occurred from an elevated minimum CBF while the[Ca2+]i oscillations occurred from a baseline that declined to the basal level (n = 15 cells). F, at relatively high concentrations, ATP (>16 µm) induced an initial increase in CBF and[Ca2+]i, but while the CBF was sustained at an elevated rate, the[Ca2+]i gradually decreased to the basal level (n = 9 cells).
Figure 5
Figure 5. The effects of ATP on the major parameters used to characterize the changes in CBF and[Ca2+]i
A, the concentration-response relationship for ATP on the normalized mean maximum CBF (max, triangles) and minimum CBF (min, circles) and B the frequency of the oscillations in CBF (squares) for the two representative cells shown in Fig. 3 (Cell 1, filled symbols, Cell 2,open symbols). With increasing ATP concentrations, the mean maximum and minimum CBF were relatively constant, while the frequency of the oscillations in CBF increased. C, the averaged effects of ATP on the characteristics of the CBF oscillations; 4 µm (n = 8 cells) or 8 µm (n = 9 cells) ATP induced a significantly higher frequency of the oscillation in CBF as compared to that induced by 1 µm ATP (n = 6 cells, squares) whereas increasing concentrations of ATP did not significantly alter the response of mean maximum CBF (triangles). The addition of 4 µm ATP caused a higher elevation in normalized minimum CBF (1.45 ± 0.09, n = 8 cells, P < 0.05) as compared to that induced by 1 µm ATP (1.17 ± 0.05, n = 6 cells, circles), but no statistical difference was found between the effects induced by 8 µm ATP (1.40 ± 0.08, n = 9 cells); *P < 0.05, **P < 0.01, ***P < 0.001. A concentration-response relationship between the CBF and ATP concentration is evident when the non-oscillatory CBF responses (○, not connected by lines) to ATP concentrations of 0.1 (1.05 ± 0.03, n = 5), 32 (1.47 ± 0.06, n = 6) and 100 µm (1.69 ± 0.06, n = 6)) are considered. Data values are represented as means ±s.e.m.
Figure 6
Figure 6. Simultaneous changes in CBF (•) and[Ca2+]i (magenta line) in response to 1, 4 and 8 µm ATP-γ-S (horizontal bar) observed in three representative ciliated cells
In all cases, ATP-γ-S induced an initial rapid increase in both[Ca2+]i and CBF that was followed by oscillations in both[Ca2+]i and CBF. The minimum CBF remained elevated while the minimum level of the[Ca2+]i declined to the basal level. Higher [ATP-γ-S] induced a higher frequency of the oscillations in CBF. These responses were indistinguishable from the effects induced by similar concentrations of ATP.
Figure 7
Figure 7. The simultaneous effects of the metabolites of ATP hydrolysis on CBF (•) and[Ca2+]i (magenta line)
A, representative recording of the effect of 8 µm ADP on CBF and[Ca2+]i shows that the CBF was slightly elevated (normalized CBF 1.06 ± 0.03, n = 5 cells) while there was no change in[Ca2+]i. B, representative recording of the effect of 8 µm AMP on CBF and[Ca2+]i shows that the CBF gradually increased to a sustained normalized rate of 1.23 ± 0.07 (n = 4 cells) again, without any change in[Ca2+]i. C, representative recording of the effect 8 µm adenosine on changes in CBF and[Ca2+]i shows a similar increase in the normalized CBF to 1.29 ± 0.06 (n = 9 cells) without a change in[Ca2+]i.
Figure 8
Figure 8. The effect of buffering the[Ca2+]i with BAPTA AM on the response to ATP and ATP-γ-S
A, representative response of a ciliated cell pre-treated with 20 µm BAPTA AM and exposed to 8 µm ATP-γ-S (horizontal bar). The BAPTA buffering prevented any increases in[Ca2+]i (magenta line) and abolished the CBF response (•; n = 6 cells). B, representative ciliated cell pre-treated with 20 µm BAPTA AM and exposed to 8 µm ATP (n = 5 cells). No substantial increase in either the[Ca2+]i or the CBF occurred.
Figure 9
Figure 9. The simultaneous changes in CBF and[Ca2+]i in response to (A) the removal of ATP, (B and C) low-levels of Ca2+ buffering
A, a cell was stimulated with 4 µm ATP to induce a typical response in both CBF (•) and[Ca2+]i (magenta line). Once the oscillatory responses in CBF and[Ca2+]i were established, the ATP was washed away, with the result that the oscillations in CBF and[Ca2+]i ceased. However, the CBF initially remained at the elevated minimum rate and only gradually returned to the basal rate (lower dotted line) with an average half-life time of 88.0 ± 5.6 s (n = 6 cells). B and C, the CBF and[Ca2+]i responses induced by 8 µm ATP in a representative ciliated cell before (B) and after (C) 2.5 µm BAPTA AM treatment. The addition of ATP elicited a typical oscillatory response in both CBF and[Ca2+]i (B) but the same cell after treatment with 2.5 µm BAPTA AM, only responded to ATP with a sustained changes in CBF and[Ca2+]i (C). While the[Ca2+]i gradually declined to the basal rate, the CBF remained at an elevated rate (n = 6 cells).
Figure 10
Figure 10. The effects of (A) thapsigargin and (B and C) flash photolysis of caged Ca2+ on the[Ca2+]i (magenta line) and CBF (•)
A, response to 2 µm thapsigargin (horizontal bar), the representative ciliated cell showed a relatively slow increase in both CBF and[Ca2+]i. After the maximal increase (231 ± 12 nm, n = 4),[Ca2+]i gradually returned to the basal level, with a half-life time of 56.4 ± 4.6 s (n = 4), while the CBF remained at an elevated rate. B and C, cells loaded with 20 µm Oregon Green BAPTA-1 AM and 5 µm NP-EGTA AM were exposed to UV light for 0.5 s (vertical lines). B, while a brief[Ca2+]i increase with mean half-life time of 14.8 ± 1.7 s (n = 5) was accompanied by a transient CBF response; C, a prolonged[Ca2+]i increase with mean half-life time of decay of 28.0 ± 3.6 s (n = 5) was accompanied by a sustained elevation in CBF.

Similar articles

Cited by

References

    1. Berridge MJ. Inositol trisphosphate and calcium signalling. Nature. 1993;361:315–325. - PubMed
    1. Berridge MJ. The AM and FM of calcium signalling. Nature. 1997;386:759–760. - PubMed
    1. Boitano S, Dirksen ER, Sanderson MJ. Intercellular propagation of calcium waves mediated by inositol trisphosphate. Science. 1992;258:292–295. - PubMed
    1. Bootman MD, Collins TJ, Peppiatt CM, Prothero LS, Mackenzie L, De Smet P, Travers M, Tovey SC, Seo JT, Berridge MJ, Ciccolini F, Lipp P. Calcium signalling-an overview. Semin Cell Dev Biol. 2001b;12:3–10. - PubMed
    1. Chilvers MA, O'Callaghan C. Analysis of ciliary beat pattern and beat frequency using digital high speed imaging: comparison with the photomultiplier and photodiode methods. Thorax. 2000;55:314–317. - PMC - PubMed

Publication types

MeSH terms

Substances

LinkOut - more resources