. 2003 Feb 1;546(Pt 3):751-63.
doi: 10.1113/jphysiol.2002.033365.

Involvement of intramuscular interstitial cells in nitrergic inhibition in the mouse gastric antrum

Affiliations

Involvement of intramuscular interstitial cells in nitrergic inhibition in the mouse gastric antrum

H Suzuki et al. J Physiol. .

Abstract

Intracellular recordings were made from isolated bundles of the circular muscle layer of mouse gastric antrum and the responses evoked by stimulating intrinsic nerve fibres were examined. Transmural nerve stimulation evoked a fast inhibitory junction potential (fast-IJP) which was followed initially by a smaller amplitude long lasting inhibitory junction potential (slow-IJP) and a period of excitation. The excitatory component of the response was abolished by atropine, suggesting that it resulted from the release of acetylcholine and activation of muscarinic receptors. Fast-IJPs were selectively reduced in amplitude by apamin and slow-IJPs were abolished by N(omega)-nitro-L-arginine. Slow-IJPs were associated with a drop in membrane noise, suggesting that inhibition resulted from a reduced discharge of unitary potentials by intramuscular interstitial cells of Cajal (ICC(IM)). The chloride channel blocker, anthracene-9-carboxylic acid, reduced the discharge of membrane noise in a manner similar to that detected during the slow-IJP. When recordings were made from the antrum of W/W(V) mice, which lack ICC(IM), the cholinergic and nitrergic components were absent, with only fast-IJPs being detected. The observations suggest that neurally released nitric oxide selectively targets ICC(IM) causing a hyperpolarization by suppressing the discharge of unitary potentials.


Figures
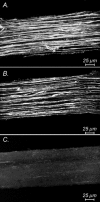
Figure 1
Figure 1. Distribution of Kit-positive cells in bundles of circular muscle isolated from the gastric antrum of BALB/c, C57BL/6 and W/WV mice
A-C reveal the distribution of Kit-positive ICC in bundles of circular muscle dissected from the gastric antrum of a BALB/c mouse (A), a C57BL/6 mouse (B) and a W/WV mouse (C). Note that elongated Kit-positive cells were readily detected in preparations obtained from BALB/c (A) and C57BL/6 (B) mice but not in W/WV mice (C). Note that a network of interconnected Kit-positive cells, ICCMY, was not detected in any of the preparations. A-C are composites of 15 × 1 µm steps within the circular muscle layer starting at the myenteric surface.
Figure 2
Figure 2. Responses evoked by transmural nerve stimulation and direct stimulation in bundles of circular muscle isolated from the gastric antrum of BALB/c mice
A brief train of stimuli (five at 5 Hz) evoked a fast-IJP followed by a wave of depolarization in control solution (A). The addition of atropine (1 µm) abolished the depolarization to reveal an underlying slow-IJP (B). Depolarizing (C) and hyperpolarizing (D) current pulses each evoked a regenerative potential. The resting membrane potential was −58 mV throughout. The time calibration bar applies to all recordings. The voltage calibration bar applies to all recordings of membrane potential. In this and subsequent figures, the horizontal dotted lines indicate the resting potential.
Figure 3
Figure 3. Inhibitory junction potentials evoked by transmural nerve stimulation in bundles of circular muscle isolated from the gastric antrum of BALB/c mice
A single stimulus evoked a fast-IJP followed by a slow-IJP (Aa). A sample of four of the ten individual traces which made up this averaged response is shown below (Ab). A train of stimuli (three at 5 Hz) evoked a larger amplitude fast-IJP followed by a slow-IJP (Ba); a sample of four of the individual traces is shown below (Bb). A train of stimuli (five at 5 Hz) evoked a more prolonged fast-IJP (C), which was again followed by a slow-IJP. Note that the individual traces are dominated by membrane noise and that this tends to decrease during the slow-IJP. All recordings were made in the presence of atropine (1 µm); the resting membrane potential was −55 mV throughout. The time and voltage calibration bars apply to all recordings.
Figure 4
Figure 4. Effect of apamin and l-NA on inhibitory junction potentials evoked by transmural nerve stimulation in bundles of circular muscle isolated from the gastric antrum of BALB/c mice
A train of stimuli (five at 5 Hz) evoked a fast-IJP followed by a slow-IJP in control solution (A). The sample of three of the individual traces which made up this averaged response, shown below, suggests that the discharge of membrane noise tends to decrease during the slow-IJP. Apamin (0.5 µm) reduced the amplitude of the fast-IJP but did not change the slow-IJP (B); again the sample of individual traces suggests that the discharge of membrane noise is decreased during the slow-IJP. In apamin and l-NA (10 µm), the amplitude of the fast-IJP was further reduced and the slow-IJP was abolished (C); the sample of individual traces indicates that the discharge of membrane noise is unchanged throughout the recording period in l-NA. All recordings were made in the presence of atropine (1 µm); the resting membrane potential was −57 mV throughout. The time and voltage calibration bars apply to all recordings.
Figure 9
Figure 9. Effect of l-NA and apamin on inhibitory potentials recorded from bundles of circular muscle isolated from the gastric antrum of C57BL/6 and W/WV mice
The left hand side of the figure shows responses, evoked by brief trains of stimuli (five at 5 Hz), recorded from the circular layer of antral muscle from a C57BL/6 mouse. In control solution a fast-IJP was followed by a slow-IJP (A). The slow-IJP was abolished by l-NA (10 µm) and the fast-IJP was reduced in amplitude from 10 to 9 mV (B). The subsequent addition of apamin (0.5 µm) further reduced the amplitude of the fast-IJP to 3 mV (C). The resting membrane potential was −55 mV in A and B and fell to −53 mV in C. In contrast, in the preparation obtained from a W/WV mouse a similar train of stimuli (five at 5 Hz) evoked only a fast-IJP (D), which was unaffected by l-NA (E) but was reduced in amplitude by apamin (F). The resting membrane potential was −57 mV in D and E and fell to −54 mV in F. The time and voltage calibration bars apply to all recordings.
Figure 5
Figure 5. Suppression of membrane noise during the slow-IJP, assessed by determining moving standard deviation of membrane potential traces
The upper trace (A) shows the average time course of responses evoked by ten successive trains of stimuli (five at 5 Hz); a fast-IJP was followed by a slow-IJP. Three of the individual traces which made up this averaged response are shown below (Aa-c). The calculated moving standard deviations of these three traces are shown overlaid in B. It can be seen that the variability was reduced during the duration of the slow-IJP. When the moving standard deviations of all traces were summed (C), the average time course of depressed variability was the same as that of the slow-IJP (A). All recordings were made in the presence of atropine (1 µm); the resting membrane potential was −58 mV. The time calibration bar applies to all recordings; the voltage calibration bar applies to all recordings of membrane potential.
Figure 6
Figure 6. Effect of slow-IJPs on discharge of membrane noise recorded from a single bundle of circular muscle isolated from the gastric antrum of BALB/c mice
The upper left trace (A) shows the average time course of responses evoked by ten successive trains of stimuli (five at 5 Hz); a fast-IJP was followed by a slow-IJP. Three of the individual traces which made up this averaged response are shown below (Aa-c). Regions of these traces, baseline and slow-IJP, were used to calculate the power spectral density curves shown in B. The theoretical curves show the spectral density curve profile expected for a Poisson string of events of the form: (eAt - eBt)3, where A = 285 ms, B = 55 ms and t is time. The power function had to be reduced by 80 % of baseline to obtain an adequate fit during the slow-IJP. The upper right trace (C) shows the average time course of ten successive trains of stimuli (five at 5 Hz) in l-NA-containing solution; the fast-IJP persisted but the slow-IJP was abolished. A sample of three of the individual traces which made up this averaged response is shown below (Ca-c). Regions of these traces, baseline and slow-IJP, were used to calculate the power spectral density curves shown in D. The same theoretical curve calculated for the control baseline (C) was found to fit both spectral density curves. The time and voltage calibration bars apply to all recordings of membrane potential.
Figure 7
Figure 7. Effect of 9-AC on discharge of membrane noise recorded from a single bundle of circular muscle isolated from the gastric antrum of BALB/c mice
The upper trace (A) shows the reduction in membrane noise produced by adding 9-AC (1 mm) to the physiological saline; the resting membrane potential increased from −56 to −60 mV. Sample membrane potential traces, recorded before and after the addition of 9-AC, are shown in B and D. These were used to calculate the power spectral density curves shown in C and E. The theoretical curves show the spectral density curve profile expected for a Poisson string of events of the form: (eAt - eBt)3, where A = 420 ms and B = 60 ms. The power function had to be reduced by 97 % of control to obtain an adequate fit in 9-AC. The voltage calibration bar applies to all recordings of membrane potential. The upper time calibration bar refers to A, the lower time calibration bar refers to traces shown in B and D.
Figure 8
Figure 8. Responses evoked by transmural nerve stimulation in bundles of circular muscle isolated from the gastric antrum of C57BL/6 and W/WV mice
In a preparation obtained from a C57BL/6 mouse, a brief train of stimuli (five at 5 Hz) evoked a fast-IJP followed by a slow-IJP and a wave of depolarization in control solution (A). The addition of atropine (1 µm) abolished the depolarization (B). The resting membrane potential was −54 mV. In contrast, in a preparation obtained from a W/WV mouse a similar train of stimuli (five at 5 Hz) evoked only a fast-IJP (C). The resting membrane potential was −57 mV. The time and voltage calibration bars apply to all recordings.

References

    1. Beckett EAH, Horiguchi K, Khoyi M, Sanders KM, Ward SM. Loss of enteric motor neurotransmission in the gastric fundus of Sl/Sld mice. J Physiol. 2002;543:871–887. - PMC - PubMed
    1. Benham CD, Bolton TB, Lang RJ. Acetylcholine activates an inward current in single mammalian smooth muscle cells. Nature. 1985;328:275–278. - PubMed
    1. Bridgewater M, Cunnane TC, Brading AF. Characteristic features of inhibitory junction potentials evoked by single stimuli in the guinea-pig isolated taenia caeci. J Physiol. 1995;485:145–155. - PMC - PubMed
    1. Burns AJ, Herbert TM, Ward SM, Sanders KM. Interstitial cells of Cajal in the guinea-pig gastrointestinal tract as revealed by c-kit immunohistochemistry. Cell Tissue Res. 1997;290:11–20. - PubMed
    1. Burns AJ, Lomax AE, Torihashi S, Sanders KM, Ward SM. Interstitial cells of Cajal mediate inhibitory neurotransmission in the stomach. Proc Natl Acad Sci U S A. 1996;93:12008–12013. - PMC - PubMed

Publication types

MeSH terms

LinkOut - more resources