

Evolution of regional performance after an acute anterior myocardial infarction in humans using magnetic resonance tagging
- PMID: 12563003
- PMCID: PMC2342596
- DOI: 10.1113/jphysiol.2002.026328
Evolution of regional performance after an acute anterior myocardial infarction in humans using magnetic resonance tagging
Abstract
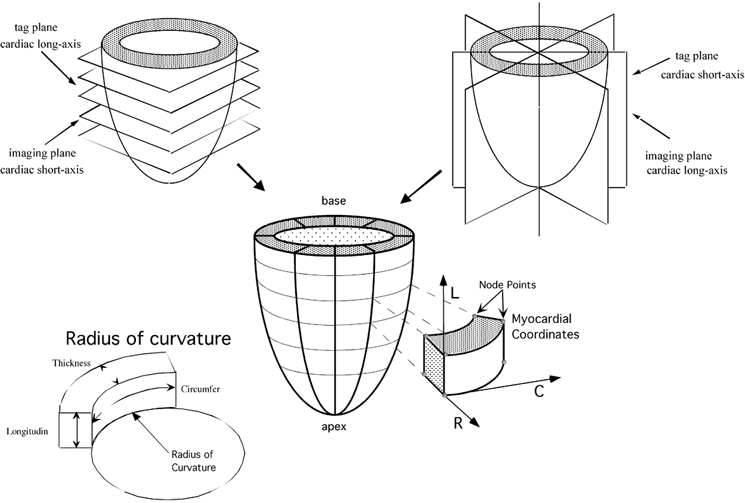
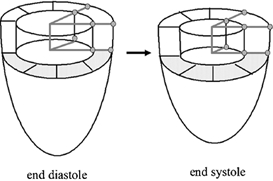
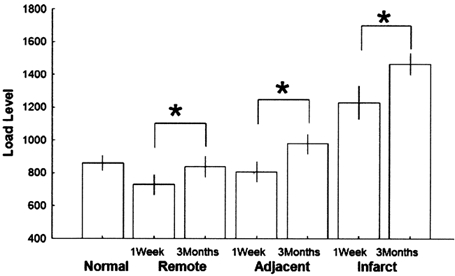
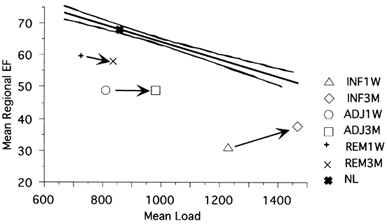
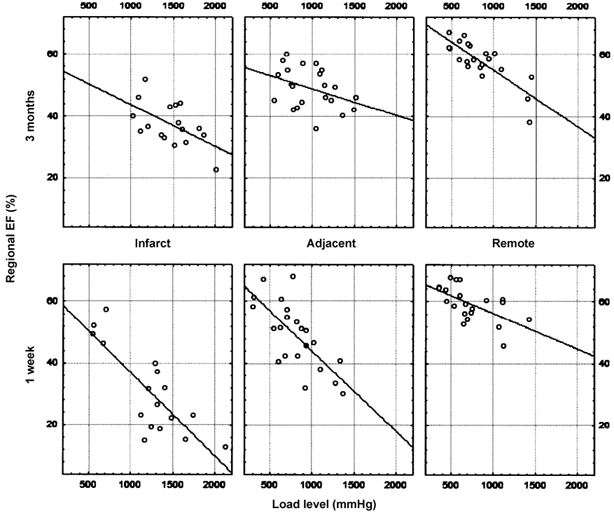
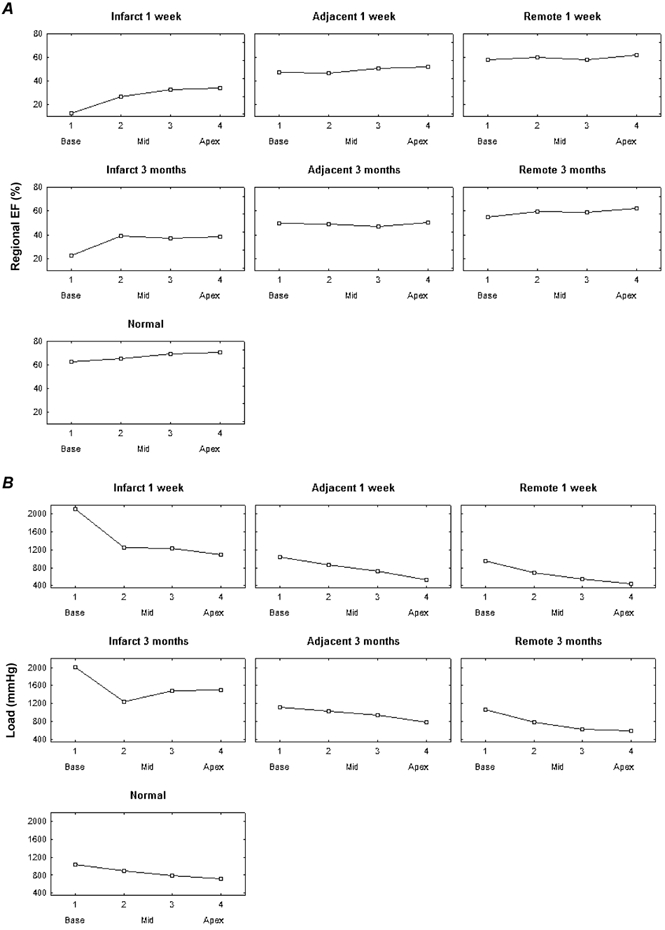
Regional remodelling after a left ventricular myocardial infarction is the first step in a cascade that may lead to heart failure and death. To understand better the mechanisms underlying this process, it is important to study not only the evolution in local deformation parameters but also the corresponding loading conditions. Using magnetic resonance (MR) myocardial tagging, we measured the regional contribution to ejection (regional ejection fraction) and loading (systolic blood pressure x radius of curvature (mean of short and long axes)/wall thickness) in 32 regions throughout the left ventricle (LV) in patients 1 week (1W) and 3 months (3M) after a first anterior infarction. Using positron emission tomography (PET), the LV was divided into infarct, adjacent and remote regions. In the remote regions the average deformation decreased between 1W and 3M (from 59.3 +/- 5.6 to 57.9 +/- 6.7 %, P < 0.05) due to an increase in loading conditions only (from 730 +/- 290 to 837 +/- 299 mmHg, P < 0.05). In the adjacent myocardium, no change in function was observed (49.0 +/- 10.8 to 49.0 +/- 6.5 %, P = n.s.), although loading increased (806 +/- 297 to 978 +/- 287 mmHg, P < 0.05). In the infarct region only, an increase in deformation was seen (30.7 +/- 14.2 to 37 +/- 6.9 %, P < 0.05), together with a higher loading level (1229 +/- 422 to 1466 +/- 284 mmHg, P < 0.05), which indicates a true improvement in function. The fact that MR tagging can identify both regional deformation and loading permits us to differentiate between changes due to alterations in regional loading conditions and true changes in function. After an acute myocardial infarction (MI), an improvement can be observed in the deformation-loading relation in the adjacent and infarct regions, but the improvement is mainly in the infarct region. Using this technique, types of intervention leading to even more functional gain could be evaluated.
Figures

Similar articles
-
Remote myocardial dysfunction after acute anterior myocardial infarction: impact of left ventricular shape on regional function: a magnetic resonance myocardial tagging study.J Am Coll Cardiol. 2000 May;35(6):1525-34. doi: 10.1016/s0735-1097(00)00601-x. J Am Coll Cardiol. 2000. PMID: 10807456
-
The impact of infarct size on regional and global left ventricular systolic function: a cardiac magnetic resonance imaging study.Int J Cardiovasc Imaging. 2015 Jun;31(5):1037-44. doi: 10.1007/s10554-015-0657-3. Epub 2015 Apr 12. Int J Cardiovasc Imaging. 2015. PMID: 25863669
-
Regional left ventricular wall thickness and systolic function during the first year after index anterior wall myocardial infarction: serial effects of ventricular remodeling.Int J Cardiol. 1996 Jan;53(1):45-54. doi: 10.1016/0167-5273(95)02507-3. Int J Cardiol. 1996. PMID: 8776277
-
Clinical aspects of left ventricular diastolic function assessed by Doppler echocardiography following acute myocardial infarction.Dan Med Bull. 2001 Nov;48(4):199-210. Dan Med Bull. 2001. PMID: 11767125 Review.
-
[Function of the residual myocardium after infarct and prognostic significance].Z Kardiol. 1997 Sep;86(9):684-90. doi: 10.1007/s003920050109. Z Kardiol. 1997. PMID: 9441529 Review. German.
Cited by
-
Regional myocardial function after intracoronary bone marrow cell injection in reperfused anterior wall infarction - a cardiovascular magnetic resonance tagging study.J Cardiovasc Magn Reson. 2011 Mar 17;13(1):22. doi: 10.1186/1532-429X-13-22. J Cardiovasc Magn Reson. 2011. PMID: 21414223 Free PMC article. Clinical Trial.
-
Role of cardiovascular magnetic resonance in acute coronary syndrome.Glob Cardiol Sci Pract. 2015 Jul 2;2015(2):24. doi: 10.5339/gcsp.2015.24. eCollection 2015. Glob Cardiol Sci Pract. 2015. PMID: 26779508 Free PMC article. Review. No abstract available.
-
Function of remote non-infarcted myocardium after STEMI: analysis with cardiovascular magnetic resonance.Int J Cardiovasc Imaging. 2012 Dec;28(8):2057-64. doi: 10.1007/s10554-012-0014-8. Epub 2012 Jan 20. Int J Cardiovasc Imaging. 2012. PMID: 22261997
-
Left Ventricular Remodeling and Heart Failure Predictors in Acute Myocardial Infarction Patients with Preserved Left Ventricular Ejection Fraction after Successful Percutaneous Intervention in Western Romania.Life (Basel). 2022 Oct 19;12(10):1636. doi: 10.3390/life12101636. Life (Basel). 2022. PMID: 36295071 Free PMC article.
-
Regional wall function before and after acute myocardial infarction; an experimental study in pigs.BMC Cardiovasc Disord. 2014 Sep 13;14:118. doi: 10.1186/1471-2261-14-118. BMC Cardiovasc Disord. 2014. PMID: 25218585 Free PMC article.
References
-
- Aikawa Y, Rohde L, Plehn J, Greaves SC, Menapace F, Arnold MO, Rouleau JL, Pfeffer MA, Lee RT, Solomon SD. Regional wall stress predicts ventricular remodeling after anteroseptal myocardial infarction in the healing and early afterload reducing trial (heart): An echocardiography-based structural analysis. Am Heart J. 2001;141:234–242. - PubMed
-
- Athanasuleas CL, Stanley Aw, Jr, Buckberg GD. Restoration of contractile function in the enlarged left ventricle by exclusion of remodeled akinetic anterior segment: Surgical strategy, myocardial protection, and angiographic results. J Card Surg. 1998;13:418–428. - PubMed
-
- Athanasuleas CL, Stanley Aw, Jr, Buckberg GD, Dor V, Didonato M, Blackstone EH. Surgical anterior ventricular endocardial restoration (saver) in the dilated remodeled ventricle after anterior myocardial infarction. Restore group. Reconstructive endoventricular surgery, returning torsion original radius elliptical shape to the lv. J Am Coll Cardiol. 2001;37:1199–1209. - PubMed
-
- Balzer P, Furber A, Delepine S, Rouleau F, Lethimonnier F, Morel O, Tadei A, Jallet P, Geslin P, Le Jeune JJ. Regional assessment of wall curvature and wall stress in left ventricle with magnetic resonance imaging. Am J Physiol. 1999;277:H901–910. - PubMed
-
- Bogaert J, Bosmans H, Maes A, Suetens P, Marchal G, Rademakers FE. Remote myocardial dysfunction after acute anterior myocardial infarction: Impact of left ventricular shape on regional function: A magnetic resonance myocardial tagging study. J Am Coll Cardiol. 2000;35:1525–1534. - PubMed
Publication types
MeSH terms
LinkOut - more resources
Full Text Sources
Medical
Miscellaneous