Autonomic nervous control of myoepithelial cells and secretion in submandibular gland of anaesthetized dogs
- PMID: 12563008
- PMCID: PMC3204443
- DOI: 10.1113/jphysiol.2002.029686
Autonomic nervous control of myoepithelial cells and secretion in submandibular gland of anaesthetized dogs
Abstract
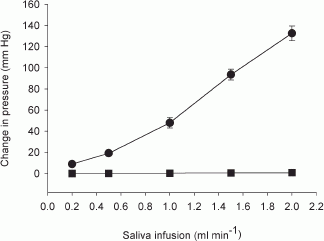
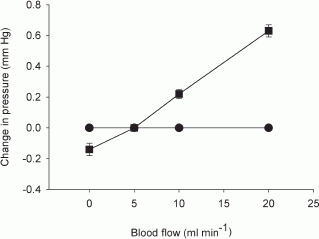
In dog submandibular gland, the activity of myoepithelial cells was assessed by simultaneous measurement of intraductal pressure (P(du)) and subcapsular pressure (P(ca)) using catheter-tip pressure transducers; their resting values were 2.5 +/- 0.21 and 3.0 +/- 0.19 mmHg, respectively (n = 40). Retrograde infusion of saliva (collected from preceding parasympathetic nerve stimulation) increased P(du) (coefficient of 50 mmHg ml(-1) for rates < 1 ml min(-1) and 85 mmHg ml(-1) for higher rates) and P(ca) (coefficient of 0.47 mmHg ml(-1) for all rates). Blood flow changes did not affect P(du) but increased P(ca) (coefficient of 0.04 mmHg ml(-1)). Parasympathetic nerve stimulation increased P(du) but decreased P(ca) abruptly; the response threshold was 0.1 Hz, with maximal responses at 16 Hz. The coefficients for P(du) and P(ca) on salivary secretion to parasympathetic nerve stimulation in glands with spontaneous blood flow (5.3 x 10(-3) and 4.87 x 10(-2) ml min(-1) g(-1) mmHg(-1)) were close to their values in glands with constant-flow vascular perfusion (4.9 x 10(-3) and 3.68 x 10(-2) ml min(-1) g(-1) mmHg(-1)). The finding that P(ca) fell despite concomitant increased blood flow suggests contraction of myoepithelial cells. Additional ductal occlusion further increased P(du) and enhanced the fall in P(ca), suggesting that the myoepithelial cells can contract when distended. Atropine blocked salivary secretion and responses of P(du) and P(ca) to parasympathetic nerve stimulation. ACh elicited responses similar to that of parasympathetic nerve stimulation. VIP caused very scanty salivary secretion and gradual slight increases in P(du) and P(ca); the change in P(ca) was abolished in glands with constant-flow vascular perfusion. Hence, contraction of myoepithelial cells to parasympathetic nerve stimulation is via muscarinic receptors. Sympathetic nerve stimulation increased P(du) and decreased P(ca) abruptly; the response threshold was 0.1 Hz, with maximal responses at 16 Hz. The coefficients for P(du) and P(ca) on salivary secretion to sympathetic nerve stimulation in glands with spontaneous blood flow (3.0 x 10(-3) and 3.2 x 10(-3) ml min(-1) g(-1) mmHg(-1)) were similar to their values in glands with constant-flow vascular perfusion (3.2 x 10(-3) and 3.1 x 10(-3) ml min(-1) g(-1) mmHg(-1)). The finding that P(ca) fell even in glands with constant-flow vascular perfusion suggests contraction of myoepithelial cells. Superimposed sympathetic nerve stimulation immediately enhanced the pressure changes and secretory response to parasympathetic nerve stimulation, indicating that the two autonomic nerves act synergistically to evoke myoepithelial cell contraction. Phentolamine and prazosin but not propranolol and yohimbine blocked the sympathetic enhancement. The finding that phenylephrine, but not clonidine and isoproterenol, abruptly decreased P(ca) in glands with constant-flow vascular perfusion suggests that the sympathetic activation of myoepithelial cells is via the alpha(1)-adrenoceptors.
Figures
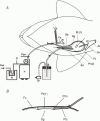
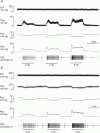

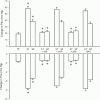
 , n = 4) responses in glands with constant-flow vascular perfusion at normal flow rate. B, peak (▪, n = 8), steady state (□, n = 8) and atropinized steady state (
 , n = 4) responses in glands with spontaneous blood flow. Peak (♦, n = 8), steady state (⋄, n = 8) and atropinized steady state (
 , n = 4) responses in glands with constant-flow vascular perfusion at normal flow rate. C, the regression coefficient for Pdu on
  is 5.3 (± 0.28) × 10−3 ml min−1 g−1 mmHg−1 (r = 0.99, n = 5, P < 0.001) for glands with spontaneous blood flow (^) and is 4.9 (±0.29) × 10−3 ml min−1 g−1 mmHg−1 (r = 0.99, n = 5, P < 0.001) for glands with constant-flow vascular perfusion at normal flow rate (∇).D, the regression coefficient for Pca on
  is 4.87 (± 0.20) × 10−2 ml min−1 g−1 mmHg−1 (r = 0.99, n = 5, P < 0.001) for glands with spontaneous blood flow (□) and is 3.68 (± 0.42) × 10−2 ml min−1 g−1 mmHg−1 (r = 0.99, n = 5, P < 0.001) for glands with constant-flow vascular perfusion at normal flow rate (⋄). For A and B, * P < 0.05, when compared to corresponding control. + P < 0.05, when compared to corresponding normal response.


 ) and steady state (∇) responses in glands with constant-flow vascular perfusion. B, peak (▪) and steady state (□) responses in glands with spontaneous blood flow; peak (♦) and steady state (⋄) responses in glands with constant-flow vascular perfusion at normal flow rate. For A and B, * P < 0.05, when compared to corresponding control; n = 8. C, the regression coefficient for Pdu on
  is 3.0 (± 0.29) × 10−3 ml min−1 g−1 mmHg−1 (r = 0.99, n = 5, P < 0.001) for glands with spontaneous blood flow (^) and is 3.2 (± 0.38) × 10−3 ml min−1 g−1 mmHg−1 (r = 0.99, n = 5, P < 0.001) for glands with constant-flow vascular perfusion at normal flow rate (∇). D, the regression coefficient for Pca on
  is 3.2 (±0.34) × 10−3 ml min−1 g−1 mmHg−1 (r = 0.99, n = 5, P < 0.001) for glands with spontaneous blood flow (□) and is 3.1 (± 0.49) × 10−3 ml min−1 g−1 mmHg−1 (r = 0.99, n = 5, P < 0.001) for glands with constant-flow vascular perfusion at normal flow rate (⋄).
Similar articles
-
Variations in blood flow on mandibular glandular secretion to autonomic nervous stimulations in anaesthetized dogs.J Physiol. 1990 Dec;431:479-93. doi: 10.1113/jphysiol.1990.sp018341. J Physiol. 1990. PMID: 2100314 Free PMC article.
-
Mechanisms of sympathetic enhancement and inhibition of parasympathetically induced salivary secretion in anaesthetized dogs.Br J Pharmacol. 1994 Jun;112(2):411-6. doi: 10.1111/j.1476-5381.1994.tb13087.x. Br J Pharmacol. 1994. PMID: 8075858 Free PMC article.
-
Autonomic nervous control of venous pressure and secretion in submandibular gland of anesthetized dogs.Am J Physiol. 1998 Aug;275(2):G331-41. doi: 10.1152/ajpgi.1998.275.2.G331. Am J Physiol. 1998. PMID: 9688661
-
Nerve interactions in salivary glands.J Dent Res. 1987 Feb;66(2):509-17. doi: 10.1177/00220345870660022101. J Dent Res. 1987. PMID: 3305629 Review.
-
Augmented secretion.Gen Pharmacol. 1979;10(1):15-7. doi: 10.1016/0306-3623(79)90023-5. Gen Pharmacol. 1979. PMID: 367876 Review. No abstract available.
Cited by
-
Bottom-up assembly of salivary gland microtissues for assessing myoepithelial cell function.Biomaterials. 2017 Oct;142:124-135. doi: 10.1016/j.biomaterials.2017.07.022. Epub 2017 Jul 14. Biomaterials. 2017. PMID: 28734180 Free PMC article.
-
Investigating the Role of Autonomic Dysfunction in the Pathogenesis of Depression-Related Dry Eye.Transl Vis Sci Technol. 2025 Jul 1;14(7):4. doi: 10.1167/tvst.14.7.4. Transl Vis Sci Technol. 2025. PMID: 40622202 Free PMC article.
-
A case of acute postoperative transitory sialadenosis of the submandibular glands in a healthy dog.J Vet Med Sci. 2017 Jan 10;78(12):1907-1910. doi: 10.1292/jvms.16-0324. Epub 2016 Sep 11. J Vet Med Sci. 2017. PMID: 27616555 Free PMC article.
-
Novel Insights Into Muscarinic and Purinergic Responses in Primary Cultures of Rat Lacrimal Gland Myoepithelial Cells.Invest Ophthalmol Vis Sci. 2021 Sep 2;62(12):19. doi: 10.1167/iovs.62.12.19. Invest Ophthalmol Vis Sci. 2021. PMID: 34546325 Free PMC article.
-
Xerostomia and Its Cellular Targets.Int J Mol Sci. 2023 Mar 10;24(6):5358. doi: 10.3390/ijms24065358. Int J Mol Sci. 2023. PMID: 36982432 Free PMC article. Review.
References
Publication types
MeSH terms
LinkOut - more resources
Full Text Sources
Miscellaneous

