Comparative Study
. 2003 Feb 1;546(Pt 3):869-78.
doi: 10.1113/jphysiol.2002.025270.

Fetal lamb cerebral blood flow (CBF) and oxygen tensions during hypoxia: a comparison of laser Doppler and microsphere measurements of CBF

Affiliations
Comparative Study

Fetal lamb cerebral blood flow (CBF) and oxygen tensions during hypoxia: a comparison of laser Doppler and microsphere measurements of CBF

John M Bishai et al. J Physiol. .

Abstract

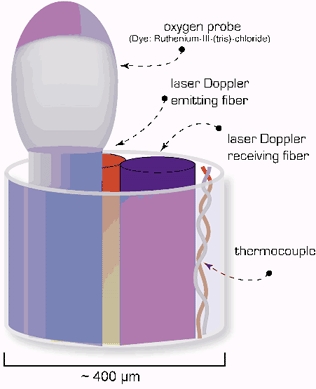
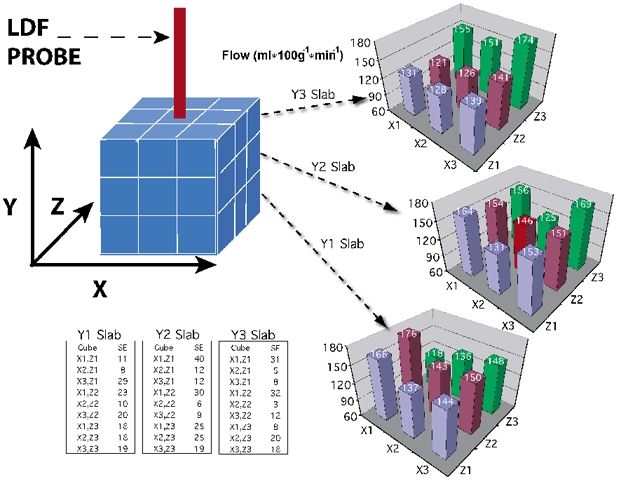
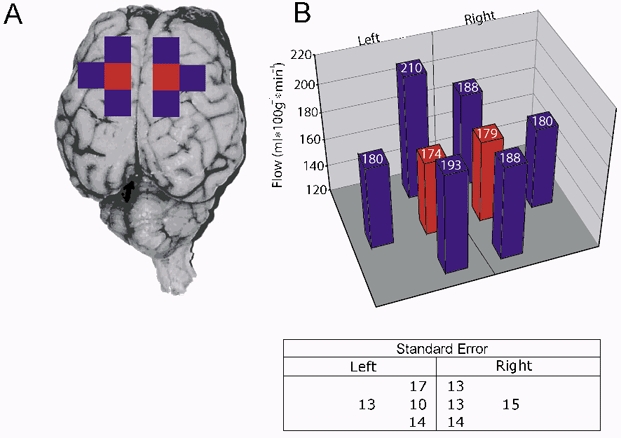
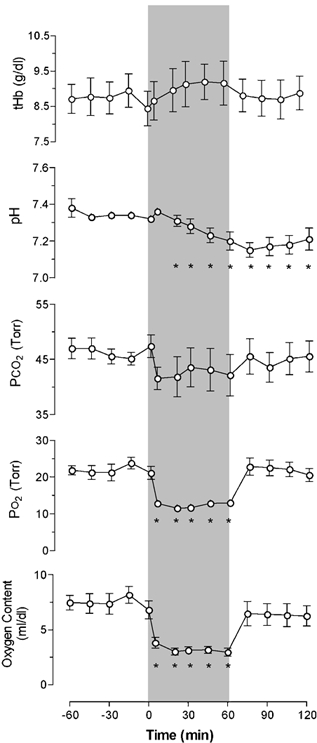
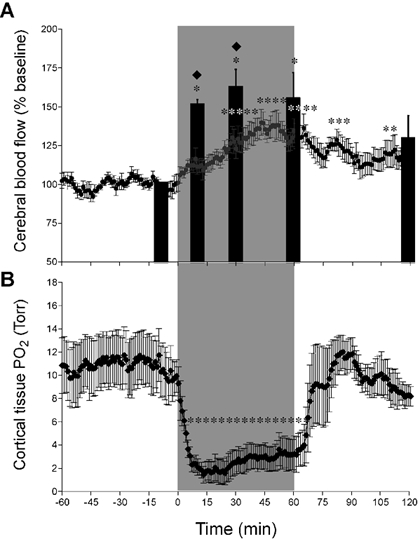
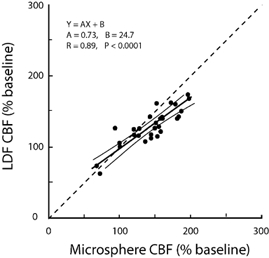
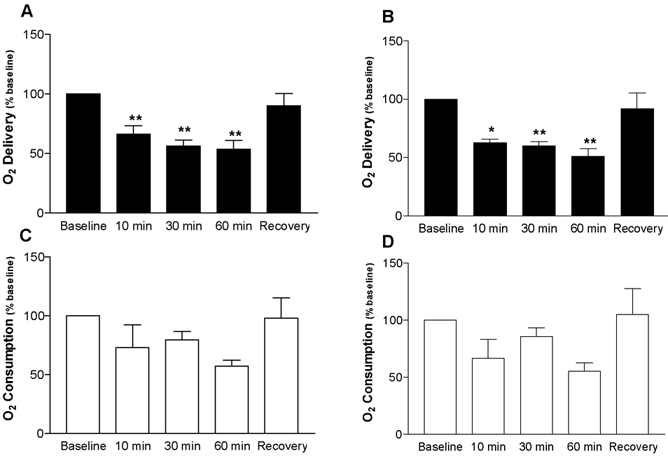
This study was undertaken to compare microsphere and laser Doppler flowmetry techniques for the measurement of cerebral blood flow, to assess the effect of probe implantation at the tip of the sensing probe and to measure brain tissue P(O2) (tP(O2)) in response to acute hypoxia. Fetal sheep of ~131 days gestation (n = 8) were chronically instrumented with bilateral laser Doppler probes in the parietal cortices and catheters for injection of fluorescent microspheres. Five days after surgery fetuses were subjected to 1 h periods of baseline control breathing, hypoxia and recovery. Microspheres were injected 10 min prior to and 10, 30, 50 and 120 min after initiation of hypoxia. Microspheres were counted in four 12 mm(3) tissue samples from each hemisphere, the tip of the laser Doppler probe being positioned in the centre of one of the cubes. The cube containing the probe tip was also subdivided into 4 mm(3) pieces of tissue. In response to hypoxia, fetal arterial P(O2) declined from 21 +/- 2 to 12 +/- 1 Torr and brain tissue P(O2) fell from 10 +/- 1 to a nadir of 1 +/- 1 Torr. Each method detected a significant increase in CBF that reached a maximum after 30-45 min, although the increase of flow measured by laser Doppler flowmetry was less than that measured by spheres after 10 and 30 min (P < 0.05). Microspheres did not detect altered flow at the probe tip or heterogeneity of flow in surrounding volumes of cortical tissue. In summary, laser Doppler flowmetry is a useful measure of continuous relative changes of CBF in the chronically instrumented fetal sheep. Flow compensations in acute hypoxia are not adequate to sustain O(2) delivery, and other compensations, including reduced metabolic rate, are possible.


Figures

Figure 1
Figure 1. Schematic diagram of 4-channel composite probe consisting of a laser Doppler component with separate emitting and receiving channels, a thermocouple, and a PO2 probe
The O2 probe emits short pulses of blue LED light resulting in a fluorescent discharge of a dye on the probe surface. The fluorescence is quenched in proportion to O2 concentration in the tissue. (Adapted from Oxford Optronix Ltd, Oxylite User's Manual.)
Figure 5
Figure 5. Blood flow at the probe tip and surrounding tissue as determined by microspheres (n = 4 probe sites)
Brain cortices were sectioned into 27 cubes, 4 mm on edge with the probe in the centre cube. Significant differences in flow were not observed 5 days after probe placement. Values indicate millilitres per minute per 100 gram of tissue.
Figure 6
Figure 6. Comparison of blood flow as measured by spheres in eight regions of the parietal cortex (n = 7)
A, regions consisted of neighbouring 12 mm3 cubes from the right and left sides. Significant differences were not detected. B, values indicate millilitres per minute per 100 gram of tissue.
Figure 2
Figure 2. Fetal arterial blood gases, pH, O2 content and haemoglobin concentration
After a 1 h control period, responses to 1 h periods of hypoxia (beginning at time zero and indicated by the shaded band) and recovery are shown (n = 7). Means ± s.e.m.; *P < 0.05.
Figure 3
Figure 3. Responses of cerebral blood flow (CBF) and cerebral PO2 to 1 h periods of hypoxia and recovery in seven near-term fetal sheep
A, results shown as a percentage of baseline; * significantly different from baseline, P < 0.05. Microsphere determinations were made at −10, 10, 30, 60 and 120 min after onset of hypoxia, and results are shown as filled columns. Running 1 min averages of laser Doppler results are shown throughout the experiment. Results of the two methods differed measurably after 10 and 30 min (P < 0.05), but were indistinguishable after 60 and 120 min. B, O2 tension in cortical brain tissue in response to a 1 h period of moderate hypoxia followed by a 1 h period of recovery (n = 4). * Significant difference from baseline (P < 0.05). Note the markedly low levels of tPO2 soon after the onset of hypoxia and the increase thereafter in association with the progressive increase of CBF.
Figure 4
Figure 4. Relationship between laser Doppler flowmetry (LDF) and microsphere (MS) methods of measuring CBF
The slope of the regression was significantly less than unity (dashed line) indicating a tendency for MS to overestimate and/or LDF to underestimate increases of flow.
Figure 7
Figure 7. Relationship between arterial oxygen content (Ca,O2) and cerebral blood flow (CBF), expressed as a percentage of baseline
Data were obtained from baseline, hypoxic and recovery periods from seven fetal sheep. Regression equations for both methods are shown. Results of laser Doppler and microsphere methods were similar and showed a progressive influence of Ca,O2 as values declined below ≈4 ml dl−1.
Figure 8
Figure 8. O2 delivery to the brain and O2 consumption by the brain, as calculated using flows obtained with laser Doppler flowmetry (A and C) and microspheres (B and D)
A, O2 delivery, calculated as the product of CBF, calculated as a percentage of baseline, and arterial oxygen content, decreased using data from both methods (n = 5). B, oxygen consumption, calculated as the product of CBF, calculated as a percentage of baseline and arterial - sagittal sinus O2 content also declined, but changes did not reach significance.

Similar articles

Cited by

References

    1. Ashwal S, Majcher JS, Longo LD. Patterns of fetal lamb regional cerebral blood flow during and after prolonged hypoxia: studies during the posthypoxic recovery period. Am J Obstet Gynecol. 1981;139:365–372. - PubMed
    1. Ashwal S, Majcher JS, Vain N, Longo LD. Patterns of fetal lamb regional cerebral blood flow during and after prolonged hypoxia. Pediatr Res. 1980;14:1104–1110. - PubMed
    1. Bereczki D, Wei L, Otsuka T, Acuff V, Pettigrew K, Patlak C, Fenstermacher J. Hypoxia increases velocity of blood flow through parenchymal microvascular systems in rat brain. J Cereb Blood Flow Metab. 1993;13:475–486. - PubMed
    1. Dirnagl U, Kaplan B, Jacewicz M, Pulsinelli W. Continuous measurement of cerebral cortical blood flow by laser-Doppler flowmetry in a rat stroke model. J Cereb Blood Flow Metab. 1989;9:589–596. - PubMed
    1. Ehmke H. Developmental physiology of the cardiovascular system. Am J Physiol Regul Integr Comp Physiol. 2002;282:R331–333. - PubMed

Publication types

LinkOut - more resources