. 2003 Feb 1;546(Pt 3):903-19.
doi: 10.1113/jphysiol.2002.027748.

Centre and surround responses of marmoset lateral geniculate neurones at different temporal frequencies

Affiliations

Centre and surround responses of marmoset lateral geniculate neurones at different temporal frequencies

Bjørg Elisabeth Kilavik et al. J Physiol. .

Abstract

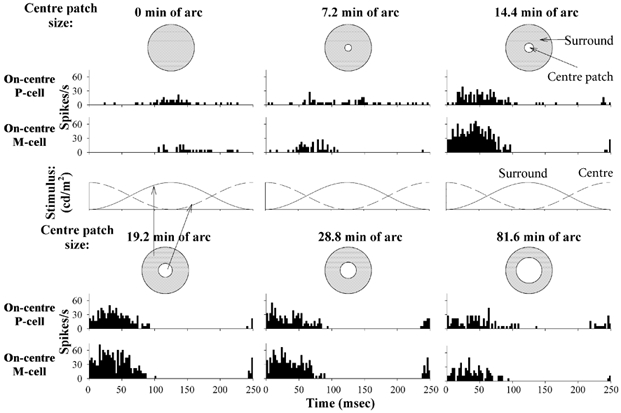
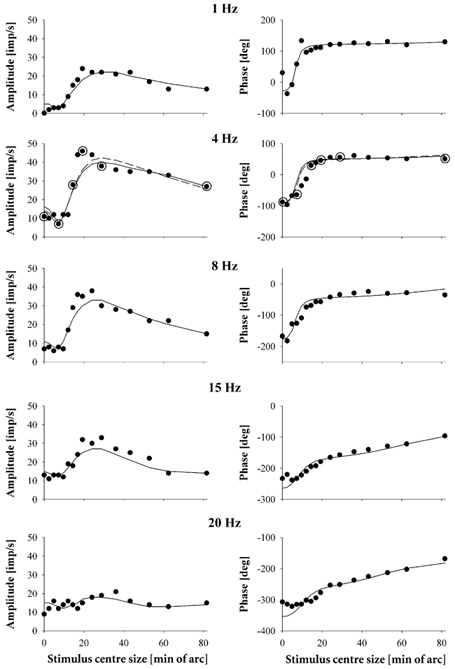
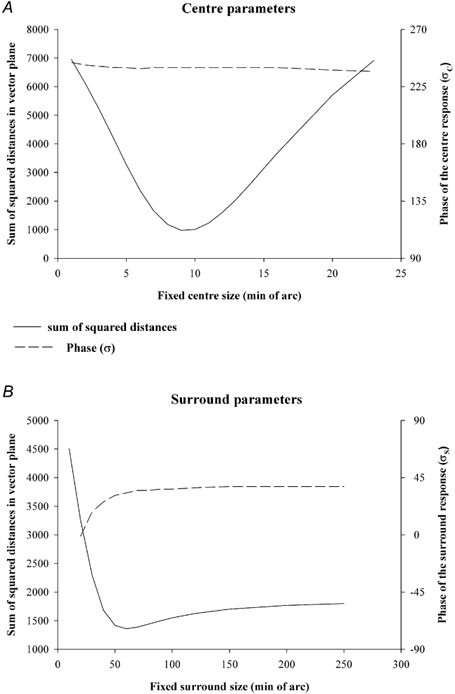
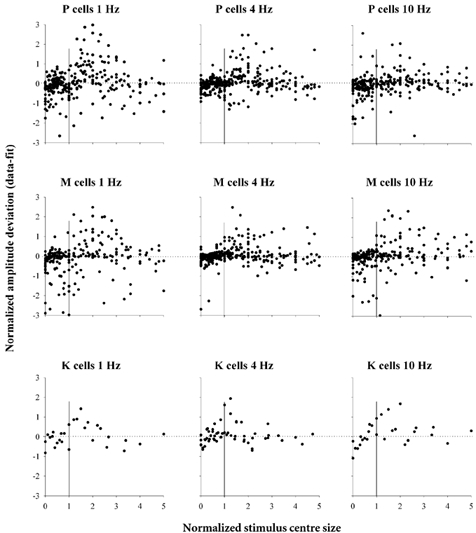
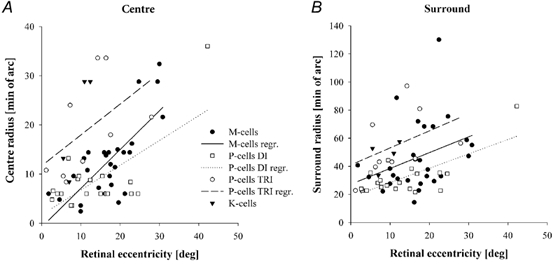
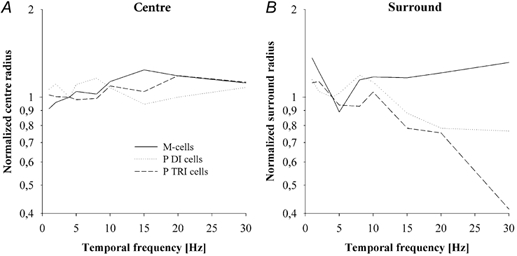
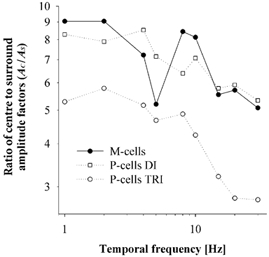
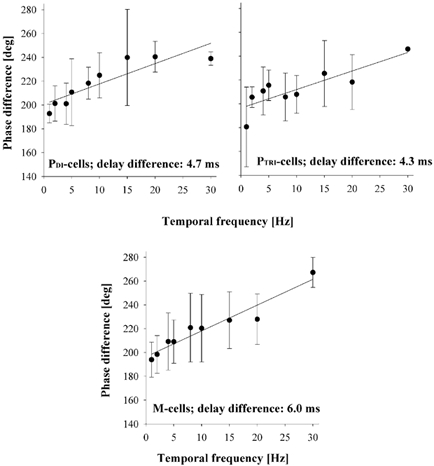
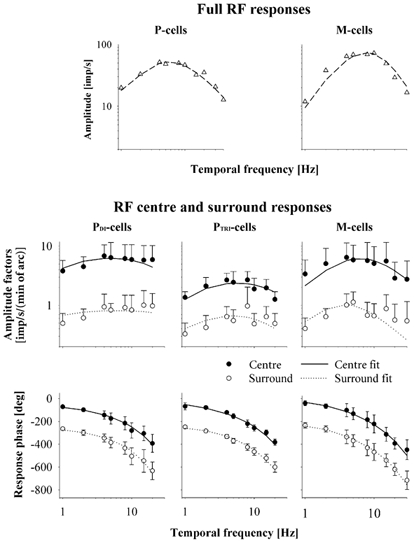
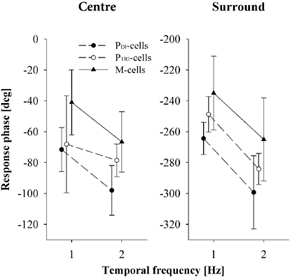
The responses of marmoset lateral geniculate neurones to stimuli that were composed of a sinusoidally modulating centre stimulus and a surround that was modulated in counterphase were measured. The size of the stimulus centre was varied. These measurements were repeated at different temporal frequencies between 1 and 30 Hz. The response amplitudes and phases depended in a characteristic manner on the stimulus centre size. The response behaviour could be modelled by assuming Gaussian responsivity profiles of the cells' receptive field (RF) centres and surrounds and a phase delay in the RF surround responses, relative to the centre, enabling the description of RF centre and surround response characteristics. We found that the RF centre-to-surround phase difference increased linearly with increasing temporal frequency, indicating a constant delay difference of about 4.5 to 6 ms. A linear model, including low-pass filters, a lead lag stage and a delay, was used to describe the mean RF centre and surround responses. The separate RF centre and surround responses were less band pass than the full receptive field responses of the cells. The linear model provided less satisfactory fits to M-cell responses than to those of P-cells, indicating additional nonlinearities.


Figures

Figure 1
Figure 1. Responses of an on-centre P-cell and an on-centre M-cell
Responses of an on-centre P-cell in a trichromatic animal (1st and 3rd row of PSTHs) and an on-centre M-cell (2nd and 4th row) to different stimulus centre sizes, at a temporal frequency of 4 Hz. The M-cell had a slightly smaller RF centre size than the P-cell. One cycle (250 ms) is shown. 0 min of arc centre stimulus size indicates full field stimulation of the cell. The responses of the cells depended on stimulus centre size in a characteristic manner. For the P-cell, a minimal response amplitude was reached at about 7.2 min of arc for this particular cell and coincided with a large phase change. The minimal response of the M-cell occurred at a smaller centre stimulus size (not shown). The maximal response amplitude was achieved at approximately 19.2 min of arc for the P-cell and at approximately 14.4 min of arc for the M-cell.
Figure 2
Figure 2. Response amplitudes and phases of an on-centre P-cell
Response amplitudes (left panels) and phases (right panels) of the same on-centre P-cell, the responses of which are shown in Fig. 1, plotted as a function of stimulus centre size. Separate plots are shown for responses at five different temporal frequencies. The encircled data points at 4 Hz are the responses the PSTHs of which are shown in Fig. 1. The drawn curves are fits of a model that assumes Gaussian responsivity profiles and independent phases of RF centre and surround responses. The parameters obtained for the 4 Hz data are as follows: Ac: 2.85 imp s−1 (min of arc)−1; σc: 9.6 min of arc; φc: 225 deg; As: 0.24 imp s−1 (min of arc)−1; σs: 69.6 min of arc; φs: 20 deg; the estimated phase difference between centre and surround responses was 205 deg. The dashed curve in the 4 Hz plot is a fit of the model to the data using the solver routine of the Excel 97 program. The estimates of the parameters obtained this fit are: Ac: 3.03 imp s−1 (min of arc)−1; σc: 10.1 min of arc; φc: 238 deg; As: 0.32 imp s−1 (min of arc)−1; σs: 56.4 min of arc; φs: 32 deg; the estimated phase difference between centre and surround responses was 206 deg.
Figure 3
Figure 3. Test of the reliability of the fitting parameters
A, the reliability of the centre parameters estimated from the model fits to the 4 Hz data, shown in Fig. 2, were tested. The surround parameters were fixed to the values obtained from the overall fits. The centre size was also fixed in a fit. The fits were repeated for different centre sizes. The goodness of fit (quantified by the sum of squared distances in the vector plane; left ordinate) and the phase of the centre response (σc; right ordinate) are shown as a function of the centre size. The sum of squared distances displays a clear minimum, indicating the best combination of parameters and that the centre parameters can be estimated reliably. The value of σc was robust for the different centre sizes. The reliability of surround parameters was also tested (Fig. 3B). Centre parameters were taken from the overall fits. The surround size was varied in the different fits. The sum of squared distances displays a minimum but the increase is shallow for larger surround sizes. The value of σs is again relatively robust.
Figure 4
Figure 4. Deviations between model fits and measured data
The normalized deviation in amplitudes, between the model fits and the measured responses, plotted as a function of normalized stimulus centre size. The amplitude deviation (ordinate) has been normalized for each cell to the full field response amplitude. The stimulus centre size (abscissa) has been normalized to the RF centre size of each individual cell. The data are shown separately for each cell type, at three different temporal frequencies.
Figure 5
Figure 5. RF centre and surround sizes as a function of retinal eccentricity
RF centre (left panel) and surround (right panel) sizes, measured at 4 Hz temporal frequency, as a function of retinal eccentricity. Linear regressions are shown for the M-cells and separately for the P-cells from dichromatic (PDI) and trichromatic (PTRI) animals. RF centre and surround sizes increase for all cell types with increasing retinal eccentricity with a somewhat steeper increase for the M-cells than for the P-cells.
Figure 6
Figure 6. Mean RF centre and surround sizes vs. temporal frequency
Mean RF centre (left panel) and surround (right panel) sizes of M- and P-cells as a function of temporal frequency. The data are normalized to 1 at 4 Hz. The data show no obvious influence of temporal frequency on RF centre or surround sizes.
Figure 7
Figure 7. Ratios of RF centre-to-surround amplitude factors vs. temporal frequency
The mean ratio of RF centre-to-surround amplitude factors of P-cells in dichromats and trichromats and of M-cells as a function of temporal frequency. For all cell types, there is a decrease in the ratio with increasing temporal frequency, indicating that the RF surrounds have a higher temporal resolution than the RF centres. The dichromats have similar ratios for both M- and P-cells, whereas the trichromats clearly have smaller P-cell amplitude factor ratios than the dichromats.
Figure 8
Figure 8. Phase difference between RF centre and surround responses vs. temporal frequency
The mean phase difference between RF centre and surround responses as a function of temporal frequency, plotted separately for M- and P-cells. The phase difference increases with increasing temporal frequency and the approximately linear relationship between the two indicates a pure time delay difference between centre and surround responses. This time delay difference is about 4.7 ms for the PDI-cells, 4.3 ms for the PTRI-cells and 6.0 ms for the M-cells.
Figure 9
Figure 9. Amplitude factors and phases of RF centre and surround responses vs. temporal frequency - a comparison with full field response amplitudes
Mean RF centre and surround amplitude factors (middle panels) and phases (lower panels) shown as a function of temporal frequency for P-cells from dichromats and from trichromats and for M-cells. The curves are fits of a linear model including a lead lag, a delay and a cascade of low-pass filters. A reasonably good fit could be obtained. The model fits are less satisfactory for the M-cell RF centres at low temporal frequencies and surrounds at high temporal frequencies. Replots of the mean amplitudes of full field responses in dichromatic animals (Kremers et al. 1997) are displayed in the upper panels as a function of temporal frequency. The full field responses are more band pass than the separate responses of the RF centres and surrounds.
Figure 10
Figure 10. Response phase at low temporal frequencies
The mean response phases of M- and P-cells at 1 and 2 Hz temporal frequency, separately for the RF centres and surrounds, replotted with a higher response phase resolution. For clarity, the data from the different cell types have been displaced by 0.1 Hz along the abscissa relative to each other. The M-cell RF centre and surround responses are generally phase-advanced compared to those of the P-cells at low temporal frequencies.

Similar articles

Cited by

References

    1. Benardete EA, Kaplan E. The receptive field or the primate P retinal ganglion cells, I: Linear systems. Vis Neurosci. 1997;14:169–185. - PubMed
    1. Benardete EA, Kaplan E. The dynamics of primate M retinal ganglion cells. Vis Neurosci. 1999;16:355–368. - PubMed
    1. Benardete EA, Kaplan E, Knight BW. Contrast gain control in the primate retina: P cells are not X-like, some M cells are. Vis Neurosci. 1992;8:483–486. - PubMed
    1. Blakemore CB, Vital-Durand F. Organization and post-natal development of the monkey's lateral geniculate nucleus. J Physiol. 1986;380:453–491. - PMC - PubMed
    1. Croner LJ, Kaplan E. Receptive fields of P and M ganglion cells across the primate retina. Vision Res. 1995;35:7–24. - PubMed

Publication types

LinkOut - more resources