. 2003 Feb 1;546(Pt 3):931-42.
doi: 10.1113/jphysiol.2002.029553.

The effect of diazepam on motor cortical oscillations and corticomuscular coherence studied in man

Affiliations

The effect of diazepam on motor cortical oscillations and corticomuscular coherence studied in man

Mark R Baker et al. J Physiol. .

Abstract

EEG recordings from sensorimotor cortex show oscillations around 10 and 20 Hz. These modulate with task performance, and are strongest during periods of steady contraction. The 20 Hz oscillations are coherent with contralateral EMG. Computer modelling suggests that oscillations arising within the cortex may be especially dependent on inhibitory systems. The benzodiazepine diazepam enhances the size of GABA(A) IPSPs; its effects are reversed by the antagonist flumazenil. We tested the effect of these drugs on spectral measures of EEG and EMG, whilst eight healthy human subjects performed a precision grip task containing both holding and movement phases. Either an auxotonic or isometric load was used. EEG changes following electrical stimulation of the contralateral median nerve were also assessed. The EEG power showed similar changes in all task/stimulation protocols used. Power around 20 Hz doubled at the highest dose of diazepam used (5 mg), and returned to control levels following flumazenil. EEG power at 10 Hz was by contrast little altered. The peak frequency of EEG power in both bands was not changed by diazepam. Corticomuscular coherence at ca 20 Hz was reduced following diazepam injection, but the magnitude of this effect was small (mean coherence during steady holding in the auxotonic task was 0.062 in control recordings, 0.051 after 2.5 mg and 5 mg doses of diazepam). These results imply that 20 Hz oscillations in the sensorimotor cortex are at least partially produced by local cortical circuits reliant on GABA(A)-mediated intracortical inhibition, whereas 10 Hz rhythms arise by a different mechanism. Rhythms generated during different tasks, or following nerve stimulation, are likely to arise from similar mechanisms. By examining the formulae used to calculate coherence, we show that if cortical oscillations are simply transmitted to the periphery, corticomuscular coherence should increase in parallel with the ratio of EEG to EMG power. The relative constancy of coherence even when the amplitude of cortical oscillations is perturbed suggests that corticomuscular coherence itself may have a functional role in motor control.


Figures
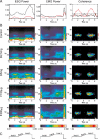
Figure 1
Figure 1. Auxotonic task
Each column presents a different measure: EEG power, EMG power or EEG-EMG coherence. Measures have been summed across all eight subjects recorded from, and across the five muscles recorded from (for EMG power and coherence). A, modulation of the power or coherence with task performance during the control experiment (before drug administration). Time is relative to the trial onset. The black line is for 8.75–11.25 Hz band, the red line for 17.5–27.5 Hz. Dotted lines in the coherence graph show the significance levels for each plot (P < 0.05). B, modulation of each measurement is shown as a function of both frequency and time, using the colour scale at the bottom of the figure. Each row shows the results for successive experiments with different drug dosages. Control, before drug administration; D2.5 mg, diazepam 2.5 mg; D5 mg, diazepam 5 mg; F150 µg, flumazenil 150 µg; F300 µg, flumazenil 300 µg. Black and red bars to the right of the control displays indicate the frequencies averaged to form the plots in A. C, schematic of lever target positions, in the same time frame as A and B.
Figure 2
Figure 2. Comparison of different measures following successive drug doses with the same measures made during the control experiment, for the auxotonic task
A and B refer to the 8.75–11.25 Hz band, C-E to the 17.5–27.5 Hz band. A and C, the EEG power; B and D, the EMG power. Power has been expressed relative to that seen in the control experiment; a ratio of one (dotted line) would indicate no change. E, EEG-EMG coherence, expressed as a difference between the Z-transformed values following drug administration and the control. Different shading indicates measurements made during the three phases of the task, according to the key at the top right of the figure. Labels D2.5 mg, etc. indicate different drug doses (see legend to Fig. 1). Error bars show 1 standard error of the mean; asterisks indicate a measure significantly different from that during the control period (P < 0.05). Analysis was across n = 8 subjects for A and C, n = 40 subjects and muscles for B, D and E.
Figure 3
Figure 3. EEG power spectra with high frequency resolution calculated over the Hold 2 period of the auxotonic task
Power is expressed as a fraction of the total power at all frequencies, and is averaged across eight subjects. Each trace shows the result following a different drug dose, using the same labelling as in Fig. 1.
Figure 4
Figure 4. Modulation of different measures with task performance during the isometric task
Display conventions as in Fig. 2. A, time course of 8.75–11.25 Hz band (black lines) and 17.5–27.5 Hz band (red lines) during the control experiment. B, time-frequency representation of each measurement. Different rows indicate results after each drug administration. C, schematic lever position target for orientation to the time scale, which is the same for all plots in the figure.
Figure 5
Figure 5. Comparison between the measurements made following drug administration with those from the control experiment, for the isometric task
A and B refer to the 8.75–11.25 Hz band, C-E to the 17.5–27.5 Hz band. A and C, the EEG power, B and D, the EMG power, E, EEG-EMG coherence. Display conventions as in Fig. 2.
Figure 6
Figure 6
A and B, time course of EEG power in the 8.75–11.25 Hz and 17.5–27.5 Hz bands, respectively, following median nerve stimulation (time 0 s), in the control experiment prior to drug administration. Measurements have been averaged over 8 subjects. C and D, EEG power at different times post-stimulus following each drug dose, relative to that seen in the control experiment. The shading of the bars indicates the post-stimulus time used, and is the same as that used in the time markers in A and B. Dotted line indicates a ratio of 1, which is expected if there is no change from the control. Error bars show 1 standard error of the mean; asterisks mark a significant change from the control (P < 0.05).

Similar articles

Cited by

References

    1. Baker SN, Kilner JM, Pinches EM, Lemon RN. The role of synchrony and oscillations in the motor output. Exp Brain Res. 1999;128:109–117. - PubMed
    1. Baker SN, Olivier E, Lemon RN. Coherent oscillations in monkey motor cortex and hand muscle EMG show task dependent modulation. J Physiol. 1997;501:225–241. - PMC - PubMed
    1. Baker SN, Pinches EM, Lemon RN. Synchronization in monkey motor cortex during a precision grip task. II. Effect of oscillatory activity on corticospinal output. J Neurophysiol. 2002. in the Press. - PubMed
    1. Benignus VA. Estimation of the coherence spectrum and its confidence interval using the fast fourier transform. IEEE Trans Acoust Speech Signal Proc. 1969;17:145–150.
    1. Brown P, Salenius S, Rothwell JC, Hari R. Cortical correlate of the Piper rhythm in humans. J Neurophysiol. 1998;80:2911–2917. - PubMed

Publication types

LinkOut - more resources