. 2003 Feb 18;100(4):1717-22.
doi: 10.1073/pnas.252766999. Epub 2003 Jan 31.

The strategy for coupling the RanGTP gradient to nuclear protein export

Affiliations

The strategy for coupling the RanGTP gradient to nuclear protein export

Attila Becskei et al. Proc Natl Acad Sci U S A. .

Abstract

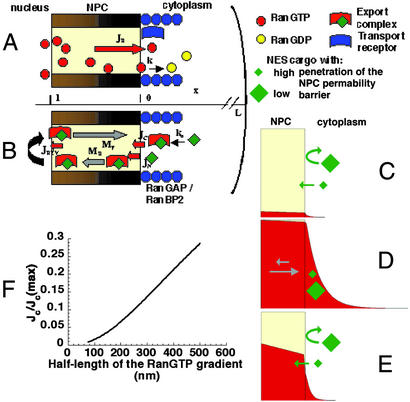
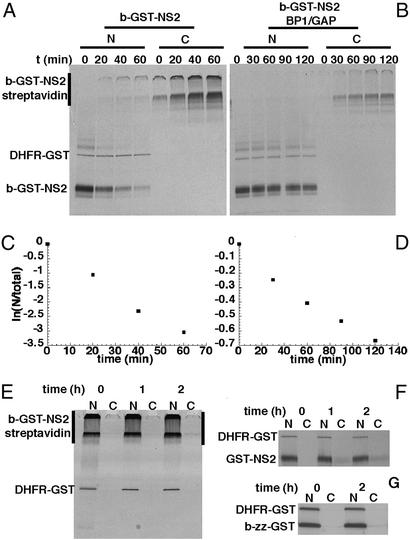
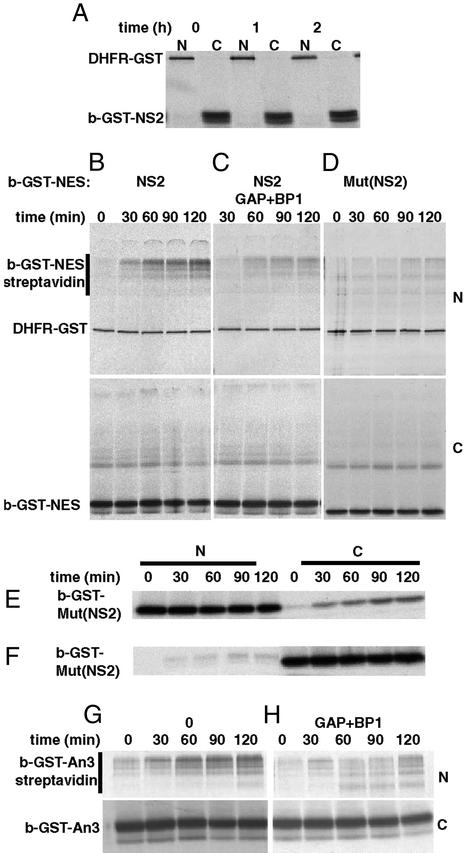
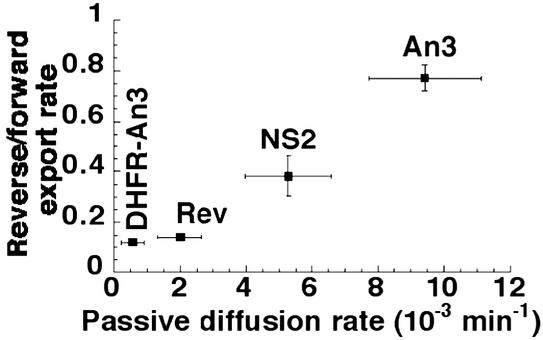
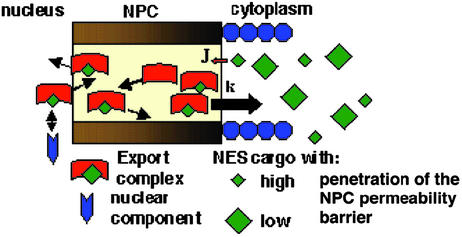
The Ran GTPase plays critical roles in both providing energy for and determining the directionality of nucleocytoplasmic transport. The mechanism that couples the RanGTP gradient to nuclear protein export will determine the rate of and limits to accumulation of export cargoes in the cytoplasm, but is presently unknown. We reasoned that plausible coupling mechanisms could be distinguished by comparing the rates of reverse motion of export cargoes through the nuclear pore complex (NPC) with the predictions of a mathematical model. Measurement of reverse export rates in Xenopus oocytes revealed that nuclear export signals can facilitate RanGTP-dependent cargo movement into the nucleus against the RanGTP gradient at rates comparable to export rates. Although export cargoes with high affinity for their receptor are exported faster than those with low affinity, their reverse transport is also greater. The ratio of the rates of reverse and forward export of a cargo is proportional to its rate of diffusion through the NPC, i.e., to the ability of the cargo to penetrate the NPC permeability barrier. The data substantiate a diffusional mechanism of coupling and suggest the existence of a high concentration of RanGTP-receptor complexes within the NPC that decreases sharply at the cytoplasmic boundary of the NPC permeability barrier.


Figures

Figure 1
Figure 1
Models of the RanGTP gradient and its coupling to export. The yellow area within the NPC represents the permeability barrier. RanGTP represents RanGTP-receptor complexes (see text). Note that all of the cartoons are illustrative rather than attempts at literal representation. (A) The formation of the RanGTP gradient is primarily determined by the flux of RanGTP (JR) accessible for export complex formation and the rate of GTP hydrolysis on Ran (k). (B) The reverse flux of export complexes (JREV) might arise from their formation either in the cytoplasm (JC) or, after permeation of export cargoes through the NPC permeability barrier (JN), within the NPC. Directional motion of export cargoes can be generated within the NPC if there is a mechanism to favor the movement in the forward direction (MF) at the expense of the reverse direction (MR). (CE) Models of the shape of the RanGTP gradient (plotted based on Eq. 6, see Supporting Methods) and reverse export in different conditions. Export complexes are formed when cargoes encounter RanGTP and CRM1 (i.e., when they enter the red field on the panels). The permeability of NES cargoes will be affected by both the size and surface properties of the cargo (29). (C) JR is low and k is high. (D) JR is high and k is low. The movement of export cargoes in the NPC is biased in the forward direction (gray arrows). (E) JR is high and k is high and the partitioning of RanGTP into the NPC from the nucleus is intermediate to high. (F) In the parametric plot both the normalized rate of complex entry into the NPC [JC/JC(max)] and the half-length of the RanGTP gradient is plotted as a function of the RanGTP hydrolysis rate. JC(max) represents JC in the absence of RanGTP hydrolysis. The following published parameter values were used for Eqs. 2 and 7: D = 5 μm2⋅s−1, l = 0.04 μm, kn = 10 s−1, kb was varied from 10 to 400 s−1 (8, 19, 30, 34).
Figure 2
Figure 2
Forward export measurements and immobilization of NES cargoes by streptavidin. (A) Streptavidin (150 μM) was injected into the cytoplasm. After 90 min, a mixture of 35S-thiophosphate-labeled DHFR-GST (nuclear injection control), b-GST-NS2, and unlabeled b-zz-GST was injected into the nucleus. (B) The same experiment as in A, but the nuclear injection mixture was supplemented by RanGAP and RanBP1 at 200 and 120 μM, respectively. (C and D) The logarithm of the ratio of the nuclear and total cell signals over time. Note that the ordinate scales are different. The results are presented as first order rates (min−1) in Table 1. (E) Injection of streptavidin with b-GST-NS2 and DHFR-GST prevents the export of b-GST-NS2 because of the formation of oligomers. (F) Coinjection of RanGAP and RanBP1 efficiently inhibits export of GST-NS2. (G) After injection of b-zz-GST into the nucleus no diffusion into the cytoplasm was observed.
Figure 3
Figure 3
Reverse export of NES cargoes. (A) DHFR-GST was injected into the nucleus. b-GST-NS2 was injected into the cytoplasm 90 min later. Nuclear and cytoplasmic fractions were examined after 0, 1, or 2 h. (BD) DHFR-GST, streptavidin, and, where indicated, RanGAP and RanBP1 were injected into the nucleus. Ninety minutes later, b-GST-NS2 or b-GST Mut (NS2), both supplemented with b-zz-GST, was injected into the cytoplasm. Nuclear and cytoplasmic fractions were examined at the indicated times. (E) b-GST and DHFR-GST were injected into the nucleus. (F) DHFR-GST was injected into the nucleus and subsequently b-GST-Mut(NS2) was injected into the cytoplasm. (G) DHFR-GST and streptavidin were injected into the nucleus. Ninety minutes later, b-GST-An3 supplemented with b-zz-GST was injected into the cytoplasm. (H) As in G, but RanGAP and RanBP1 were coinjected into the nucleus.
Figure 4
Figure 4
Dependence of the ratio of reverse and forward export on the passive diffusion rate of export cargoes. DHFR-An3, Rev, An3, and NS2 stand for b-DHFR-An3-GST, b-Rev-GST, b-NS2-GST, and b-An3-GST constructs, respectively. The values are from Table 1. The position of b-DHFR-An3-GST is approximate because the rate of reverse export of this construct is not accurately determined (<0.005 min−1).
Figure 5
Figure 5
The model of nuclear protein export. The overall movement of export cargoes does not display directionality in the NPC (arrows with random directions). Export complexes enter the NPC at a slower rate (J) than the rate of RanGTP hydrolysis (k). Export cargoes and complexes with high permeability might interact with nuclear components if they are close enough to the NPC.

Similar articles

Cited by

References

    1. Mattaj I W, Englmeier L. Annu Rev Biochem. 1998;67:265–306. - PubMed
    1. Gorlich D, Kutay U. Annu Rev Cell Dev Biol. 1999;15:607–660. - PubMed
    1. Fornerod M, Ohno M, Yoshida M, Mattaj I W. Cell. 1997;90:1051–1060. - PubMed
    1. Fukuda M, Asano S, Nakamura T, Adachi M, Yoshida M, Yanagida M, Nishida E. Nature. 1997;390:308–311. - PubMed
    1. Stade K, Ford C S, Guthrie C, Weis K. Cell. 1997;90:1041–1050. - PubMed

Publication types

MeSH terms