. 2003 Feb;13(2):216-23.
doi: 10.1101/gr.912603.

Global RNA half-life analysis in Escherichia coli reveals positional patterns of transcript degradation

Affiliations

Global RNA half-life analysis in Escherichia coli reveals positional patterns of transcript degradation

Douglas W Selinger et al. Genome Res. 2003 Feb.

Abstract

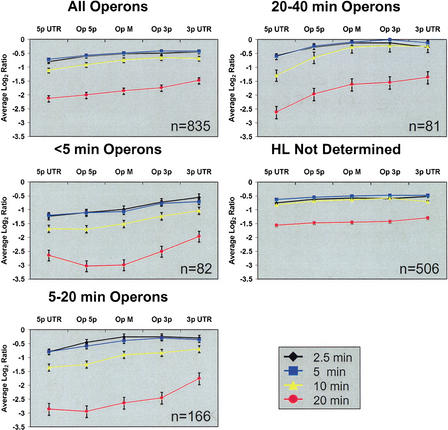
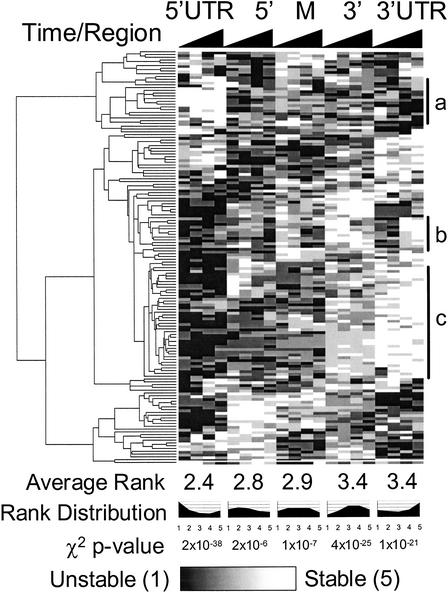
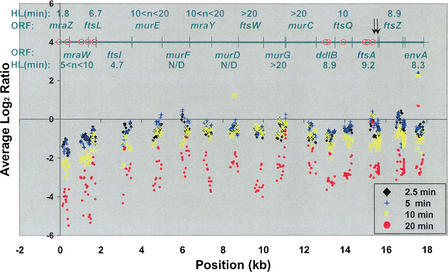
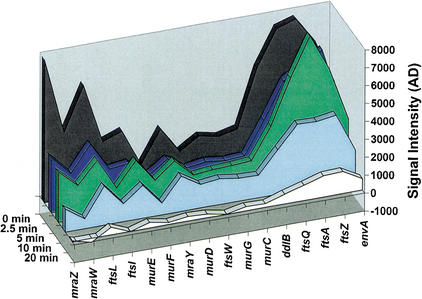
Subgenic-resolution oligonucleotide microarrays were used to study global RNA degradation in wild-type Escherichia coli MG1655. RNA chemical half-lives were measured for 1036 open reading frames (ORFs) and for 329 known and predicted operons. The half-life of total mRNA was 6.8 min under the conditions tested. We also observed significant relationships between gene functional assignments and transcript stability. Unexpectedly, transcription of a single operon (tdcABCDEFG) was relatively rifampicin-insensitive and showed significant increases 2.5 min after rifampicin addition. This supports a novel mechanism of transcription for the tdc operon, whose promoter lacks any recognizable sigma binding sites. Probe by probe analysis of all known and predicted operons showed that the 5' ends of operons degrade, on average, more quickly than the rest of the transcript, with stability increasing in a 3' direction, supporting and further generalizing the current model of a net 5' to 3' directionality of degradation. Hierarchical clustering analysis of operon degradation patterns revealed that this pattern predominates but is not exclusive. We found a weak but highly significant correlation between the degradation of adjacent operon regions, suggesting that stability is determined by a combination of local and operon-wide stability determinants. The 16 ORF dcw gene cluster, which has a complex promoter structure and a partially characterized degradation pattern, was studied at high resolution, allowing a detailed and integrated description of its abundance and degradation. We discuss the application of subgenic resolution DNA microarray analysis to study global mechanisms of RNA transcription and processing.


Figures

Figure 1.
Figure 1.
Positional differences in operon degradation. Operon regions are plotted on the x-axis, and average log2 ratios (compared to the 0 min timepoint) are plotted on the y-axis. Vertical bars indicate standard error. Operons were divided into five regions: 30 bases upstream (5p UTR) and downstream (3p UTR), and three equal-length regions of the coding region: 5 prime (Op 5p), middle (Op M), and 3 prime (Op 3p). Patterns of operons with different average half-lives were compared. A 5′ to 3′ directionality is observable in the coding regions of all operon subsets. This directionality generally extends at least 30 bases into the UTRs, although the 5′ UTR of quickly degrading operons (<5 min) seems to be more stable than the coding region. All curves in this figure have significant variation between means by one-way ANOVA at α = 0.001, with the following exceptions: 2.5 min of the ‘20–40 min’ graph, and the 5- and 20-min curves of the ‘half-life not determined’ graph, which were significant at α = 0.05, 0.05, and 0.10, respectively. P-values for timepoints on the ‘all operons’ graph were all below 1×10⁻¹².
Figure 2.
Figure 2.
Whole-genome cluster analysis of operon degradation. The degradation patterns of 149 operons (containing two or more ORFs, and oligo probes in all targeted regions) were hierarchically clustered after ranking the relative degradation rate of each region. The algorithm was implemented using the GeneCluster/TreeView package (Eisen et al. 1998). Transcript regions are on the x-axis, with each region split into 2.5-, 5-, 10-, and 20-min timepoints. The average rank increases from 5′ to 3′, supporting a predominant 5′ to 3′ directionality of degradation (cluster c). The clustering also reveals that a variety of degradation patterns are present, such as operons with relatively stable 5′ UTRs (cluster a). One group of operons (cluster b) is initially degraded most quickly at its 3′ UTR at 2.5 and 5 min, but then by the 10 min timepoint is more quickly degraded at its middle and 3′ coding regions. χ2 goodness of fit tests show that the distributions of degradation ranks are highly nonrandom, with 5′ regions more likely to be degraded quickly and 3′ regions more likely to be degraded slowly. The complete clustering file, including gene names, is available at http://arep.med.harvard.edu/rna_decay/.
Figure 3.
Figure 3.
High-resolution analysis of the dcw gene cluster transcripts. Average log2 ratios (y-axis) were plotted against operon position (x-axis) for three-probe sliding windows of the 156 probes in the dcw gene cluster, including 30 bases up- and downstream of the first and last ORFs. The positions of known promoters (red circles) and the ORFs with their estimated half-lives are given in the upper part of the graph. Arrows indicate known RNase E processing sites. An additional weak promoter is thought to be present in either murD or ftsW (Mengin-Lecreulx et al. 1998). rho-independent terminators are present in the 5′ region of mraZ and immediately downstream of envA. Degradation is fastest at the 5′ end of the operon, with three apparent regions of distinct degradation rates: The 5′ region (mraZftsI) is degraded the fastest, the middle (murEmurC) is relatively stable, and the 3′ region (ddlBenvA) is degraded at an intermediate rate.
Figure 4.
Figure 4.
Transcript abundance and degradation of the dcw gene cluster. The dcw gene cluster contains 16 ORFs involved in cell envelope biosynthesis and cell division. Several promoters have been described (see Fig. 3), and it is likely that they are all used, to varying extents. It has also been speculated that the cluster may sometimes be transcribed in its entirety. The ORFs were plotted here in the order they are transcribed, showing their array signal intensities (average differences) throughout the timecourse. Although average difference is only an approximate indicator of transcript abundance, relatively high levels of steady-state RNA are observed downstream of the mraZ and ddlB promoters, at the 5′ end and about two-thirds of the way into the transcript, respectively. The middle portion of the operon has lower steady-state RNA levels and is degraded more slowly (see Fig. 3).

References

    1. Aach J., Rindone, W., and Church, G.M. 2000. Systematic management and analysis of yeast gene expression data. Genome Res. 10: 431-445. - PubMed
    1. Bernstein J.A., Khodursky, A.B., Lin, P.H., Lin-Chao, S., and Cohen, S.N. 2002. Global analysis of mRNA decay and abundance in Escherichia coli at single-gene resolution using two-color fluorescent DNA microarrays. Proc. Natl. Acad. Sci. 99: 9697-9702. - PMC - PubMed
    1. Blattner F.R., Plunkett, G., III, Bloch, C.A., Perna, N.T., Burland, V., Riley, M., Collado-Vides, J., Glasner, J.D., Rode, C.K., Mayhew, G.F., et al. 1997. The complete genome sequence of Escherichia coli K-12. Science 277: 1453-1474. - PubMed
    1. Cam K., Rome, G., Krisch, H.M., and Bouche, J.P. 1996. RNase E processing of essential cell division genes mRNA in Escherichia coli. Nucleic Acids Res. 24: 3065-3070. - PMC - PubMed
    1. Campbell E.A., Korzheva, N., Mustaev, A., Murakami, K., Nair, S., Goldfarb, A., and Darst, S.A. 2001. Structural mechanism for rifampicin inhibition of bacterial rna polymerase. Cell 104: 901-912. - PubMed

Publication types

MeSH terms

LinkOut - more resources