. 2003 Feb;13(2):224-37.
doi: 10.1101/gr.905003.

Bacillus subtilis during feast and famine: visualization of the overall regulation of protein synthesis during glucose starvation by proteome analysis

Affiliations

Bacillus subtilis during feast and famine: visualization of the overall regulation of protein synthesis during glucose starvation by proteome analysis

Jörg Bernhardt et al. Genome Res. 2003 Feb.

Abstract

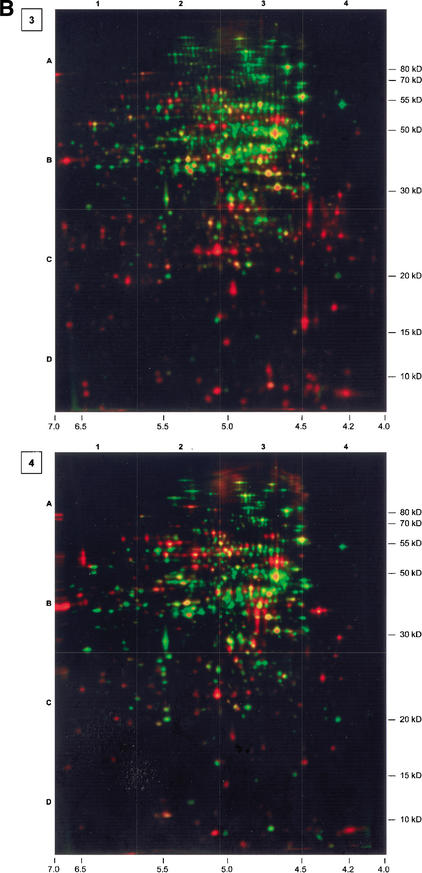
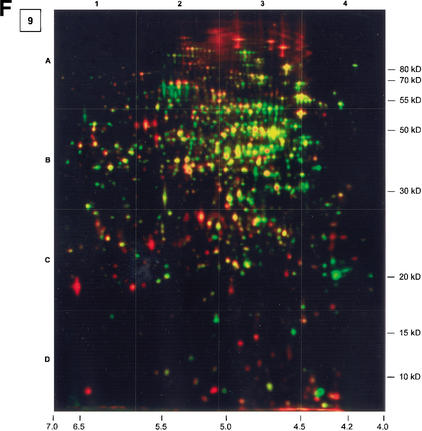
Dual channel imaging and warping of two-dimensional (2D) protein gels were used to visualize global changes of the gene expression patterns in growing Bacillus subtilis cells during entry into the stationary phase as triggered by glucose exhaustion. The 2D gels only depict single moments during the cells' growth cycle, but a sequential series of overlays obtained at specific points of the growth curve facilitates visualization of the developmental processes at the proteomics scale. During glucose starvation a substantial reprogramming of the protein synthesis pattern was found, with 150 proteins synthesized de novo and cessation of the synthesis of almost 400 proteins. Proteins induced following glucose starvation belong to two main regulation groups: general stress/starvation responses induced by different stresses or starvation stimuli (sigma(B)-dependent general stress regulon, stringent response, sporulation), and glucose-starvation-specific responses (drop in glycolysis, utilization of alternative carbon sources, gluconeogenesis). Using the dual channel approach, it was not only possible to identify those regulons or stimulons, but also to follow the fate of each single protein by the three-color code: red, newly induced but not yet accumulated; yellow, synthesized and accumulated; and green, still present, but no longer being synthesized. These green proteins, which represent a substantial part of the protein pool in the nongrowing cell, are not accessible by using DNA arrays. The combination of 2D gel electrophoresis and MALDI TOF mass spectrometry with the dual channel imaging technique provides a new and comprehensive view of the physiology of growing or starving bacterial cell populations, here for the case of the glucose-starvation response.


Figures

Figure 1.
Figure 1.
Growth of B. subtilis 168 and the isogenic sigB-mutant strain ML6. Numbers indicate the developmental stages from which samples were taken and subsequently labeled with L-[35S]-methionine. Columns show the amount of radioactivity incorporated into protein during 5 min.
Figure 2.
Figure 2.
Series of dual channel images (silver-stained protein amount, green; autoradiogram of currently synthesized protein, red). Numbers in boxes associate the images to the corresponding growth phase. For further information, see Figure 1. Gel 3 was complemented by a separate autoradiogram showing protein spots that had already been identified. The colors of the text boxes indicate the relative synthesis compared with exponential growth conditions (black, not detected; red, induced; yellow, unchanged; light green, slightly repressed; green, repressed).
Figure 2.
Figure 2.
Series of dual channel images (silver-stained protein amount, green; autoradiogram of currently synthesized protein, red). Numbers in boxes associate the images to the corresponding growth phase. For further information, see Figure 1. Gel 3 was complemented by a separate autoradiogram showing protein spots that had already been identified. The colors of the text boxes indicate the relative synthesis compared with exponential growth conditions (black, not detected; red, induced; yellow, unchanged; light green, slightly repressed; green, repressed).
Figure 3.
Figure 3.
Scatterplot (A) illustrating the correlation of amount and synthesis of proteins involved in basic carbon metabolism after 2.5 h of exponential growth (Fig. 2, Gel 1). The X-axis shows the protein amount in percentage of the whole detectable protein on the 2D gel; the Y-axis the L-[35S]-methionine incorporation corrected by the methionine content and the protein size. Scatterplot (B) shows a representative sample of mRNAs/proteins changing their expression during transient phase. The Y-axis displays the fold change of the mRNA-amount, the X-axis the fold change of methionine incorporation (protein synthesis).
Figure 4.
Figure 4.
Dual channel image of autoradiograms (protein synthesis) of B. subtilis 168 (red) and the isogenic sigB-mutant strain ML6 (green), transformed with the Delta2D two-dimensional gel analysis software. Samples were taken from cultures in the transient growth phase. Already identified spots synthesized at a higher rate in the wild type are indicated by text labels, and nonidentified spots by white circles. For spots induced in a ςB-dependent manner, see also Table 1.
Figure 5.
Figure 5.
Patterns of amount (green) and synthesis (red) of general stress/starvation and glucose starvation-specific proteins during different growth stages (columns correspond to the numbers in Fig. 1). Diagrams show protein synthesis in percentage normalized to the whole synthesis detectable on a 2D gel as described in Methods.

References

    1. Ali N.O., Bignon, J., Rapoport, G., and Debarbouille, M. 2001. Regulation of the acetoin catabolic pathway is controlled by ςL in Bacillus subtilis. J. Bacteriol. 183: 2497-2504. - PMC - PubMed
    1. Anagnostopoulos C. and Spizizen, J. 1961. Requirements for transformation in Bacillus subtilis. J. Bacteriol. 81: 741-746. - PMC - PubMed
    1. Antelmann H., Bernhardt, J., Schmid, R., Mach, H., Völker, U., and Hecker, M. 1997. First steps from a two-dimensional protein index towards a response-regulation map for Bacillus subtilis. Electrophoresis 18: 1451-1463. - PubMed
    1. Antelmann H., Tjalsma, H., Voigt, B., Ohlmeier, S., Bron, S., van Dijl, J.M., and Hecker, M. 2001. A proteomic view on genome-based signal peptide predictions. Genome Res. 11: 1484-1502. - PubMed
    1. Ballesteros M., Fredriksson, A., Henriksson, J., and Nyström, T. 2001. Bacterial senescence: Protein oxidation in non-proliferating cells is dictated by the accuracy of the ribosomes. EMBO J. 20: 5280-5289. - PMC - PubMed

Publication types

MeSH terms

LinkOut - more resources