. 2003 Feb;13(2):254-63.
doi: 10.1101/gr.612203.

Transcriptional interactions between yeast tRNA genes, flanking genes and Ty elements: a genomic point of view

Affiliations

Transcriptional interactions between yeast tRNA genes, flanking genes and Ty elements: a genomic point of view

Eric C Bolton et al. Genome Res. 2003 Feb.

Abstract

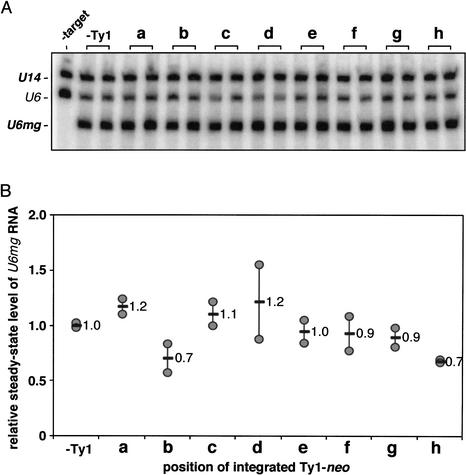
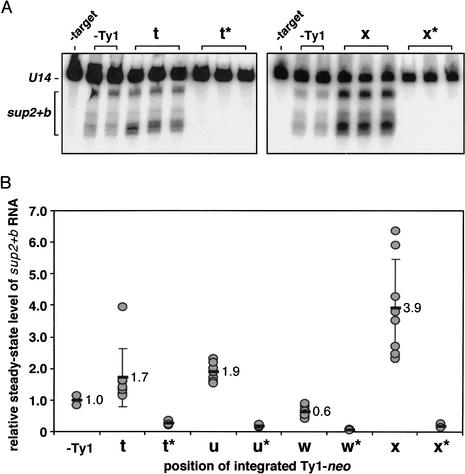
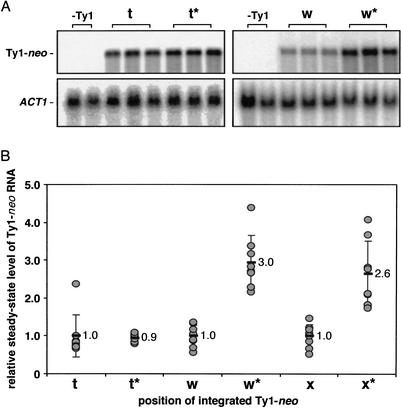
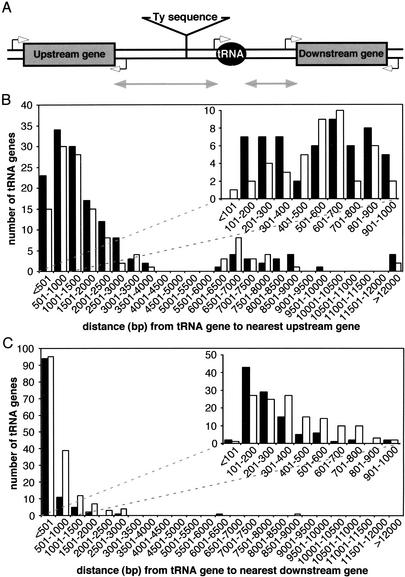
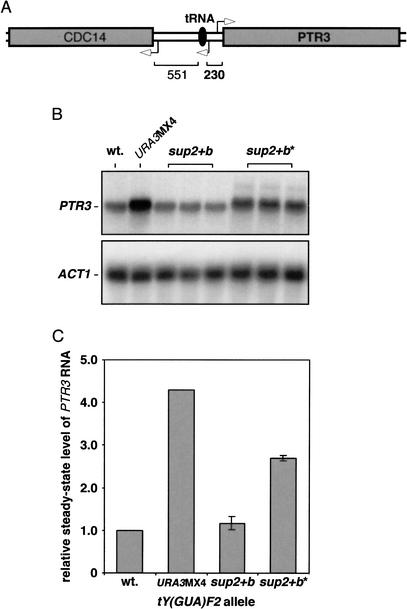
Retroelement insertion can alter the expression of nearby genes. The Saccharomyces cerevisiae retrotransposons Ty1-Ty4 are transcribed by RNA polymerase II (pol II) and target their integration upstream of genes transcribed by RNA polymerase III (pol III), mainly tRNA genes. Because tRNA genes can repress nearby pol II-transcribed genes, we hypothesized that transcriptional interference may exist between Ty1 insertions and pol III-transcribed genes, the preferred targets for Ty1 integration. Ty1s upstream of two pol III-transcribed genes (SNR6 and SUP2) were recovered and analyzed by RNA blot analysis. Ty1 insertions were found to exert a neutral or modest stimulatory effect on the expression of these genes. Further RNA analysis indicated a modest tRNA position effect on Ty1 transcription. To investigate the possible genomic relevance of these expression effects, we compiled a comprehensive tRNA gene database. This database allowed us to analyze a genome's worth of tRNA genes and Ty elements. It also enabled the prediction and experimental confirmation of tRNA gene position effects at native chromosomal loci. We provide evidence supporting the hypothesis that tRNA genes exert a modest inhibitory effect on adjacent pol II promoters. Direct analysis of PTR3 transcription, promoted by sequences very close to a tRNA gene, shows that this tRNA position effect can operate on a native chromosomal gene.


Figures

Figure 1.
Figure 1.
Integration of Ty1-neo into SNR6- and SUP2-containing target plasmids. (A) U6mg represents the marked SNR6 gene, and (B) sup2+b is the marked SUP2 gene. The term genomic signifies that the sequence is the native sequence flanking the SNR6 or SUP2 loci, respectively, whereas 2μ and HIS3 are vector sequences. Ty1-neo insertions into the target plasmids are depicted as small black arrowheads. Arrowheads pointing downward represent Ty1-neo insertions in the same transcriptional direction as the target gene, whereas those pointing upward are transcribed divergently from the target gene. The distance in base pairs from the major pol III transcription start sites (+1) is indicated (Kinsey and Sandmeyer 1991; Chalker and Sandmeyer 1993). The lowercase letters indicate the individual Ty1-neo insertion constructs that were used for expression studies.The Ty1-neo integration positions are −273, −147, −90, +318, −608, −289, −96, and −83 for a–h and −166, −105, −179, and −103 for t, u, w, and x, respectively.
Figure 2.
Figure 2.
Effect of Ty1-neo insertions on U6mg target gene expression. (A) RNA blot analysis of U6mg and U14 transcripts containing the target plasmid with a single integrated Ty1-neo element. Multiple yeast transformants containing the same Ty1-neo target plasmid were analyzed. RNA was also isolated from cells lacking the U6mg target plasmid (-target). The endogenous U6 snRNA (U6) present in all cells is indicated. The ratio of U6mg to U14 RNA was determined for each sample. These ratios were further normalized for plasmid copy number in each transformant. (B) Normalized RNA levels are relative to that of a target plasmid lacking a Ty1-neo insertion (-Ty1).
Figure 3.
Figure 3.
Effect of Ty1-neo insertions on pre-sup2+b target gene expression. (A) Representative RNA blots of pre-sup2+b and U14 transcripts from cells harboring plasmids with a Ty1-neo inserted at position t or x (* indicates the presence of a G56 mutation in box B of the sup2+b gene, rendering it transcriptionally inactive). Multiple yeast transformants containing the same Ty1-neo target plasmid were analyzed. RNA was also isolated from cells lacking the sup2+b target plasmid (-target). RNA blots are not shown for the target plasmids containing Ty1-neo insertions at positions u and w. The ratio of sup2+b to U14 RNA was determined for each sample, and normalized for plasmid copy number. As multiple species of pre-sup2+b transcript were present, indicated by the bracketed region, the sum of all bands in this region was measured. (B) RNA levels are relative to that of a target plasmid lacking a Ty1-neo insertion (-Ty1).
Figure 4.
Figure 4.
Effect of sup2+b tRNA gene expression on Ty1-neo expression. (A) Representative RNA blots of Ty1-neo and ACT1 transcripts from the cells used in the previous figure. RNA blot is not shown for the target plasmid containing Ty1-neo insertion at position x. The ratio of Ty1-neo to ACT1 RNA was determined for each sample. Ratios, or levels, were adjusted for relative plasmid copy number. (B) Ty1-neo RNA levels in the absence of an actively transcribed tRNA gene (* indicates the presence of the G56 mutation in sup2+b) are relative to those in the presence of an actively transcribed tRNA gene.
Figure 5.
Figure 5.
The tRNA gene loci database. (A) Graphic representation of the data included in the tRNA gene and Ty element database. Gene and Ty sequence nomenclature, coordinates and orientations are according to SGD. Gene expression data is according to the yeast Transcriptome database (Holstege et al. 1998). Intergenic distance measurements were based on the ORF coordinates assigned by SGD and not the start sites of transcription which remain to be determined for many genes. (B) The average intergenic window size upstream (5′, black bars) and downstream (3′, white bars) of all the tRNA genes in the genome (total). The average intergenic window size upstream (5′, black bars) and downstream (3′, white bars) of all the tRNA genes in the genome (total); if full-length Ty elements are excluded (-Ty elements); and if Ty element and LTR sequences are excluded (-Ty sequence) from the intergenic windows. The calculated mean genome-wide inter-ORF distance excluding telomeric regions (genome, gray) is indicated.
Figure 6.
Figure 6.
Genomic distribution of the distances from tRNA genes to their nearest neighbor genes. (A) Cartoon of the generic tRNA locus in the yeast genome. The gray double-headed arrows represent the distances from tRNA genes to their nearest (B) upstream and (C) downstream genes. Solid bars represent tRNA genes that are transcribed in the opposite direction as the neighboring gene, and open bars represent tRNA genes that are transcribed in the same direction as the nearby gene. The minor peaks in the distributions for distances >6,000 and 12,000 bp indicate the presence of one or two full-length Ty elements, respectively.
Figure 7.
Figure 7.
Expression level distribution of the genes upstream of tRNA genes. The expression level for each upstream gene is plotted versus the distance between the upstream ORF and the nearby tRNA gene. (A) Expression level versus intergenic distance for divergently transcribed genes at tRNA loci lacking (solid circles) and containing (open diamonds) upstream Ty sequences. (B) Expression level versus intergenic distance for convergently transcribed genes at tRNA loci lacking (solid triangles) and containing (open squares) upstream Ty sequences. The black arrow and broken black line indicate a 400-bp distance from the upstream gene to the tRNA gene. The horizontal lines (black for solid and gray for open symbols) and numbers represent the mean expression level for the distances spanned by the lines. Gene expression data is according to the yeast Transcriptome database (Holstege et al. 1998). Intergenic distance measurements were based on the ORF coordinates assigned by SGD and not the start sites of transcription, which remain to be determined for many genes.
Figure 8.
Figure 8.
Effect of a native chromosomal tRNA gene on PTR3 expression. (A) Cartoon of the tY(GUA)F2 locus on chromosome VI. Open arrowheads indicate the transcriptional orientation, and the distance between the tRNA gene and the flanking non-Ty ORFs is given in base pairs. (B) RNA blot analysis of cells containing various chromosomal alleles of the tY(GUA)F2 tRNA gene. The level of PTR3 to ACT1 RNA was determined for each sample. (C) PTR3 levels in the presence of no tRNA gene, an actively transcribed tRNA gene and a transcriptionally inactive tRNA gene are relative to those in the presence of the wild-type tRNA gene, URA3MX4, sup2+b and sup2+b* relative to wt. (* indicates the presence of the G56 mutation in sup2+b).

References

    1. Allison D.S., Goh, S.H., and Hall, B.D. 1983. The promoter sequence of a yeast tRNAtyr gene. Cell 34: 655-664. - PubMed
    1. Boeke J.D. and Devine, S.E. 1998. Yeast retrotransposons: Finding a nice quiet neighborhood. Cell 93: 1087-1089. - PubMed
    1. Boeke J.D., Sandmeyer, S.B., et al. 1991. Yeast transposable elements. In The molecular and cellular biology of the yeast Saccharomyces (ed. J.R. Broach), pp. 193–261. Cold Spring Harbor Laboratory Press, Cold Spring Harbor, N.Y.
    1. Boeke J.D., LaCroute, F., and Fink, G.R. 1984. A positive selection for mutants lacking orotidine-5′-phosphate decarboxylase activity in yeast: 5-fluoro-orotic acid resistance. Mol. Gen. Genet. 197: 345-346. - PubMed
    1. Boeke J.D., Garfinkel, D.J., Styles, C.A., and Fink, G.R. 1985. Ty elements transpose through an RNA intermediate. Cell 40: 491-500. - PubMed

Publication types

MeSH terms

LinkOut - more resources