Dynamic changes during the immune response in T cell-antigen-presenting cell clusters isolated from lymph nodes
- PMID: 12566411
- PMCID: PMC2193839
- DOI: 10.1084/jem.20021512
Dynamic changes during the immune response in T cell-antigen-presenting cell clusters isolated from lymph nodes
Abstract
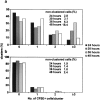
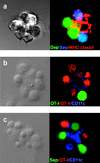
Activation of antigen-specific T cells by mature dendritic cells in secondary lymphoid organs is a key control point of the adaptive immune response. Here we describe the ex vivo isolation of preformed multicellular clusters between T cells and antigen-presenting cells. Adoptively transferred, antigen-specific T cells segregated into individual clusters where their activation and proliferation was initiated in vivo. Transit of the T cell cohort through the cluster compartment required 32-36 h. The precise timing of the response to agonistic epitopes was remarkably invariant regardless of the T cell lineage, the major histocompatibility complex haplotype, and the antigen dose. Interestingly, initiation of cell division of T cells specific for a subdominant epitope and a weak agonist was delayed by 6 h. The results provide a basis for the analysis of short range, mutual cell-cell interactions within such confined microenvironments.
Figures


Similar articles
-
Antigen-bearing dendritic cells in the draining lymph nodes of contact sensitized mice: cluster formation with lymphocytes.Immunology. 1991 Sep;74(1):139-45. Immunology. 1991. PMID: 1937567 Free PMC article.
-
The strategy of T cell antigen-presenting cell encounter in antigen-draining lymph nodes revealed by imaging of initial T cell activation.J Exp Med. 2003 Sep 1;198(5):715-24. doi: 10.1084/jem.20030167. J Exp Med. 2003. PMID: 12953093 Free PMC article.
-
Limiting dilution analysis of proliferating and helper T cells in the in vivo immune response to KLH: derepression of helper T cells at moderately increased frequencies.J Mol Cell Immunol. 1986;2(5):293-305. J Mol Cell Immunol. 1986. PMID: 2978234
-
Immunoregulation mediated by T-cell clusters.Folia Biol (Praha). 1994;40(6):359-69. Folia Biol (Praha). 1994. PMID: 7589695 Review. No abstract available.
-
Visualizing the first 50 hr of the primary immune response to a soluble antigen.Immunity. 2004 Sep;21(3):341-7. doi: 10.1016/j.immuni.2004.08.007. Immunity. 2004. PMID: 15357945 Review.
Cited by
-
Imaging the single cell dynamics of CD4+ T cell activation by dendritic cells in lymph nodes.J Exp Med. 2004 Oct 4;200(7):847-56. doi: 10.1084/jem.20041236. J Exp Med. 2004. PMID: 15466619 Free PMC article.
-
Dendritic cell-mimicking scaffolds for ex vivo T cell expansion.Bioact Mater. 2022 Sep 11;21:241-252. doi: 10.1016/j.bioactmat.2022.08.015. eCollection 2023 Mar. Bioact Mater. 2022. PMID: 36157246 Free PMC article.
-
Landscape of innate immune system transcriptome and acute T cell-mediated rejection of human kidney allografts.JCI Insight. 2019 Jul 11;4(13):e128014. doi: 10.1172/jci.insight.128014. eCollection 2019 Jul 11. JCI Insight. 2019. PMID: 31292297 Free PMC article.
-
ICAM-1-dependent homotypic aggregates regulate CD8 T cell effector function and differentiation during T cell activation.J Immunol. 2013 Oct 1;191(7):3681-93. doi: 10.4049/jimmunol.1201954. Epub 2013 Aug 30. J Immunol. 2013. PMID: 23997225 Free PMC article.
-
LFA-1 in T cell priming, differentiation, and effector functions.Trends Immunol. 2021 Aug;42(8):706-722. doi: 10.1016/j.it.2021.06.004. Epub 2021 Jul 12. Trends Immunol. 2021. PMID: 34266767 Free PMC article. Review.
References
-
- Banchereau, J., and R.M. Steinman. 1998. Dendritic cells and the control of immunity. Nature. 392:245–252. - PubMed
-
- Dustin, M.L., and A.C. Chan. 2000. Signaling takes shape in the immune system. Cell. 103:283–294. - PubMed
-
- Weiss, A. 1999. T-lymphocyte activation. Fundamental Immunology, 4th edition. W.E. Paul, editor. Lippincott-Raven, Philadelphia/New York. 411–445.
-
- van Stipdonk, M.J.B., E.E. Lemmens, and S.P. Schoenberger. 2001. Naive CTLs require a single brief period of antigenic stimulation for clonal expansion and differentiation. Nat. Immunol. 2:423–429. - PubMed
-
- Iezzi, G., K. Karjalainen, and A. Lanzavecchia. 1998. The duration of antigenic stimulation determines the fate of naive and effector T cells. Immunity. 8:89–95. - PubMed
Publication types
MeSH terms
Substances
LinkOut - more resources
Full Text Sources
Other Literature Sources

